 , do one of the following:
Change Period/Data Range
Brief
The article explains how to change the period and data range of a chart.
Details
Working with a chart, you can change either its period or data range or both of them.
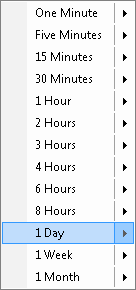
To change the period, on the toolbar, in the Period box
, do one of the following:
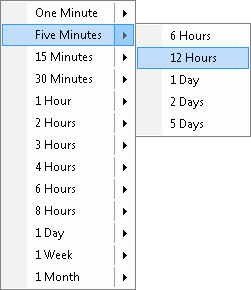
To change the data range of the chart, on the toolbar, in the
Period box , do the
following:
Note: You can also change the data range of the chart by scrolling it. For details, see Scrolling.
To change both the chart period and data range, do the following:
Note: You cannot change the chart period to Tick. To view a tick chart, create a chart by typing or clicking T in the Period box of the Create Chart dialog box. For details, see Create Chart.
Working with a tick chart, you can change only the data range.
To change the data range of a Tick chart, do one of the following:
 , click the arrow
button, and then click the data range of your choice.
, click the arrow
button, and then click the data range of your choice.Note: You cannot change the Tick period to any other chart period. To view a chart of another period, create a chart by selecting another than Tick period in the Period box of the Create Chart dialog box. For details, see Create Chart.