- On the File menu, click Options.
- Right-click in the chart and then click Options.
* In the FXCM Trading Station, the command is available on the System menu.
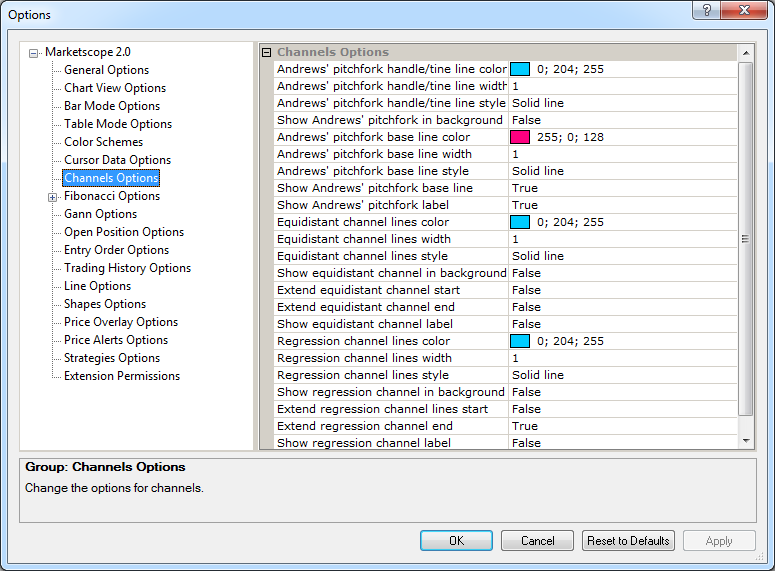
Channels Options
Brief
The article explains how to customize the options of the Channel group of tools.
Details
The Channel group of tools includes Andrews' Pitchfork, Equidistant Channel, and Regression Channel. While working with the tools, you can customize their options in a variety of
ways: show or hide various elements of the tool, customize their colors, widths, and styles, etc.
To customize the options of the tools
Andrews' Pitchfork options
Option |
Description |
Andrews' pitchfork handle/tine line color |
The option allows selecting the default color of the pitchfork handle and tine lines: click in the option row, click the ellipsis
|
Andrews' pitchfork handle/tine line width |
The option allows selecting the default width of the pitchfork handle and tine lines: click in the option row, highlight or delete the existing value, and then type or select a width value of your choice. The values are whole numbers from 1 through 5. |
Andrews' pitchfork handle/tine line style |
The option allows selecting the default style of the pitchfork handle and tine lines: click in the option row, click the arrow |
Show Andrews' pitchfork in background |
The option allows selecting how to show the Andrews' pitchfork tool by default: in the background (behind the chart bars) or in the forefront (in front of the chart bars). To select, click in the option row, click the
arrow |
Andrews' pitchfork base line color |
The option allows selecting the default color of the pitchfork base line: click in the option row, click the ellipsis |
Andrews' pitchfork base line width |
The option allows selecting the default width of the pitchfork base line: click in the option row, highlight or delete the existing value, and then type or select a width value of your choice. The values are whole numbers from 1 through 5. |
Andrews' pitchfork base line style |
The option allows selecting the default style of the pitchfork base line: click in the option row, click the arrow |
Show Andrews' pitchfork base line |
The option allows selecting whether to show the Andrews' pitchfork base line on a chart by default or not: click in the option row, click the arrow
|
Show Andrews' pitchfork label |
The option allows selecting whether to show the Andrews' pitchfork label on a chart by default or not: click in the option row, click the arrow |
The Equidistant Channel options
Option |
Description |
Equidistant channel line color |
The option allows selecting the default color of the Equidistant channel lines: click in the option row, click the ellipsis |
Equidistant channel line width |
The option allows selecting the default width of the Equidistant channel lines: click in the option row, highlight or delete the existing value, and then type or select a width value of your choice. The values are whole numbers from 1 through 5. |
Equidistant channel line style |
The option allows selecting the default style of the Equidistant channel lines: click in the option row, click the arrow |
Show equidistant channel in background |
The option allows selecting how to show the Equidistant channel by default: in the background (behind the chart bars) or in the forefront (in front of the chart bars). To select, click in the option row, click the
arrow |
Extend equidistant channel start |
The option allows selecting whether to extend the Equidistant channel lines beyond their starting points or not: click in the option row, click the arrow
|
Extend equidistant channel end |
The option allows selecting whether to extend the Equidistant channel lines beyond their ending points or not: click in the option row, click the arrow
|
Show equidistant channel label |
The option allows selecting whether to show the Equidistant channel label on a chart by default or not: click in the option row, click the arrow |
The Regression Channel options
Option |
Description |
Regression channel lines color |
The option allows selecting the default color of the Regression channel lines: click in the option row, click the ellipsis |
Regression channel lines width |
The option allows selecting the default width of the Regression channel lines: click in the option row, highlight or delete the existing value, and then type or select a width value of your choice. The values are whole numbers from 1 through 5. |
Regression channel lines style |
The option allows selecting the default style of the Regression channel lines: click in the option row, click the arrow |
Show regression channel in background |
The option allows selecting how to show the Regression channel by default: in the background (behind the chart bars) or in the forefront (in front of the chart bars). To select, click in the option row, click the
arrow |
Extend Regression channel lines start |
The option allows selecting whether to extend the Regression channel lines at their starting points or not: click in the option row, click the arrow
|
Extend regression channel end |
The option allows selecting whether to extend the Regression channel lines at their ending points or not: click in the option row, click the arrow
|
Show regression channel label |
The option allows selecting whether to show the Regression channel label on a chart by default or not: click in the option row, click the arrow |
To enable the modified values, click OK at the bottom of the dialog box.
 button, and then, in the Color palette that appears, select a color of your choice.