To display the window, on a chart, click a period of your choice, and the window appears for a few seconds.
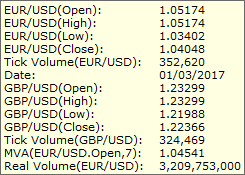
Chart Data Tooltip
Brief
The article describes the Chart data tooltip and explains how to work with it.
Details
The Chart data tooltip is a window providing chart related data of a selected period, such as Open, High, Low, and Close prices and Tick Volume of the chart and price overlay
instruments, the chart creation date, values and some parameters of the indicators added to the chart, etc.
To display the window, on a chart, click a period of your choice, and the window appears for a few seconds.