* When a chart is opened within the FXCM Trading Station, the command is available on the Charts menu.
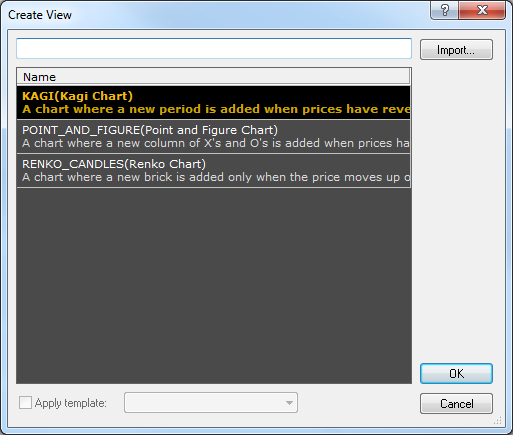
- Click the chart you want to create.
Note: You can search for the chart by typing its name in the filter box at the top of the dialog box. - (Optional) To apply a template to the chart, select the
Apply template check box, and then click the template of your choice in the list.
Note: The check box is enabled if you have at least one template saved. - (Optional) To display the chart within the FXCM Trading Station, select the Open within Trading Station check box.
- Click OK.
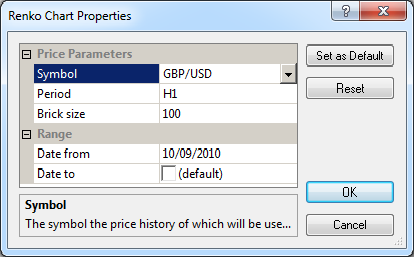
Note: The set of parameters depends on the selected chart. The Renko Candles chart set of parameters is provided as an example.
- In the Symbol box, select the symbol, the price history of which is to be displayed on the chart.
- In the Period box, select a period of your choice. Note that the close prices of the OHLC bars of the selected period are used as source prices to create a chart. Thus, by selecting the period, you specify the time interval (minutes, hours, days, etc), at which the prices are picked up to draw the chart.
- Specify other price parameters that may be required depending on the selected chart. For example, for the Renko Candles chart, you need to specify the candle size in pips.
Note: The data range is defined by the time interval, the price history of which is displayed to create the chart. You need to specify the starting and ending dates of this interval. Marketscope retrieves from your computer or downloads from the server the price history of the time interval in bars and then builds the chart using the close prices of these bars. The bar period is selected during the previous step. Note also that the maximum number of periods that can be used for creating the chart depends on the available price history for the selected symbol but, in any case, cannot exceed 15,000. It means that, if the number of periods of the time interval you specified is greater than 15,000, only 15,000 periods before the ending date are used to create the chart.
- To create a chart with the data range from a certain date in the past to the current date that updates in real-time, in the Date from box, select or type the starting date of the data range and leave the Date to box as is.
- To create a chart with the whole data range in the past, in the Date from box, select or type the starting date of the data range; select the Date to check box, and then select or type the ending date of the data range that precedes the current moment.
 next to the chart's name.