Price Overlaying
Brief
The article explains how to view prices of a number of symbols on one screen.
Details
You can overlay a chart of some other symbol on your current chart or
in an additional area below it. This is useful when you use different
symbols for technical analysis and want to see their prices for the same
period and data range simultaneously.
Note that, if the current chart's period is Tick, you cannot overlay any other but a tick chart on it.
On a chart, you can add a price overlay of only one symbol, and the prices are always
presented in the form of a line. Whereas below the chart, you can add more than one price overlay, and each overlay
is presented in the same mode as the current chart's mode.
Add Price Overlay
To add a price overlay
- Do one of the following:
- On the toolbar, click the Price Overlay button.

- On the Insert menu, click Price Overlay.
- Right-click in the chart, point to Chart Elements on the shortcut menu that appears, and
then click Price Overlay.
* When a chart is opened within the FXCM Trading Station, the command is available on the Insert submenu of
the Charts menu.
- The Price Overlay dialog box appears. By default, it is opened on the Symbol tab.
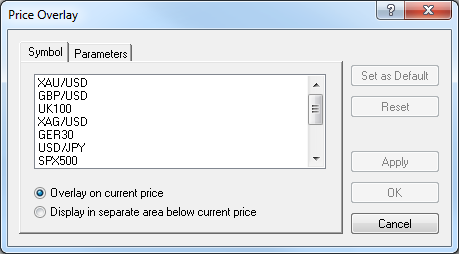
- Specify the Symbol tab's settings:
- In the list of available symbols, click a symbol of your choice.
- To display a price overlay on the current chart, click Overlay on current price.
- To display a price overlay in an additional area below the chart, click Display in separate area below
current price.
- To specify the Parameters tab's settings, click Parameters.
- Depending on what option button is clicked on the Symbol tab, one of the three
versions of the Price Overlay dialog box can appear:
- When Overlay on current price option button is clicked, the following version appears.
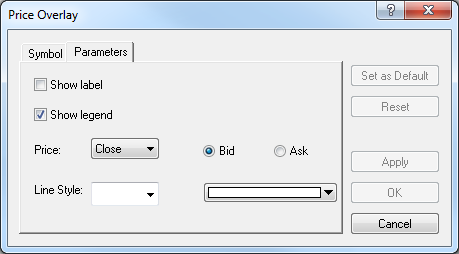
- To show the label, select the Show label check box. Otherwise, clear the
check box.
- To show the legend, select the Show legend check box. Otherwise, clear the
check box.
- In the Price box, click the arrow, and then click a price source of your choice (Open, High, Low,
or Close, etc).
- To show bid or ask prices, click Bid or Ask.
- In the appropriate Line Style boxes select the price overlay line width and/or color of your choice.
- When Display in separate area below current price option button is clicked, and the current chart's mode is Line, the following version appears.
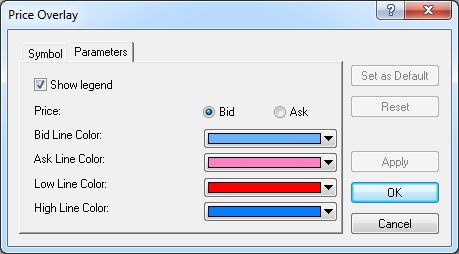
- To show the legend, select the Show legend check box. Otherwise, clear the
check box.
- To show bid or ask prices, click Bid or Ask.
- In the Bid Line Color, Ask Line Color, Low Line Color, and High Line Color boxes, select colors of your choice.
- When Display in separate area below current price option button is clicked, and the current chart's mode is either Candlestick or Bar,
the following version appears.
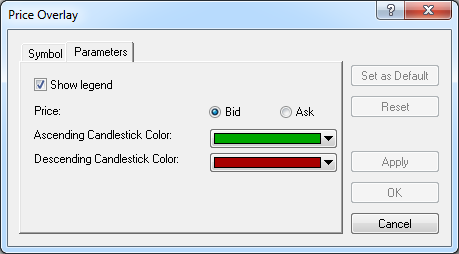
- To show the legend, select the Show legend check box. Otherwise, clear the
check box.
- To show bid or ask prices, click Bid or Ask.
- In the Ascending Candlestick/Bar Color and Descending Candlestick/Bar Color boxes, select colors of your choice.
- Click OK.
Change Price Overlay Properties
To change the properties of a price overlay
- Do one of the following:
- Double-click the price overlay (line, candlestick, or bar).
- Right-click the price overlay (line, candlestick, or bar), its legend, or label, and then click 'Symbol'
Properties where 'Symbol' is the symbol of the price overlay.
- See Change Properties/Remove Chart Elements.
- Depending on where the price overlay is added (to the price chart or in an additional area below it), one of the three versions of 'Symbol' Properties dialog
boxes appears (see item 5 of Add Price Overlay).
- Specify the properties at your choice (see items 3 through 5 of Add Price Overlay).
Notes:
- To apply the modified properties to all further price overlays by default, click
Set as Default.
- To reset a price overlay's factory settings, click Reset.
- Click OK.
Remove Price Overlay
To remove a price overlay
- Right-click the price overlay (line, candlestick, or bar), its legend, or label, and then click Remove.
- On the price chart, click the price overlay (line), and then press DELETE.
- See Eraser Tool.
- See Change Properties/Remove Chart Elements.
Note that a price overlay displayed in an additional area is removed together
with the area.
Moreover, by right-clicking in the area and selecting the appropriate
commands, you can add indicators and other chart elements to this chart.
A price overlay options can be modified. For more information, see
Price Overlay Options.
back