- On the File menu, click Options.
- Right-click in the chart and then click Options.
* In the FXCM Trading Station, the command is available on the System menu.
Shape Options
Brief
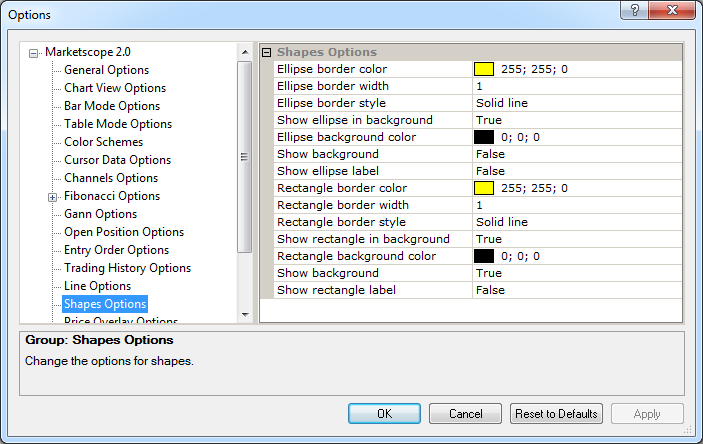
The article explains how to customize the options of shapes added to a chart with the help of the Add Shape tool.
Details
The Add Shape tool allows adding to a chart ellipses, rectangles, and arrows.
You can customize the options of ellipses and rectangles in a variety of ways: select border and background colors, border line styles and widths, show or hide backgrounds and labels, etc.
To customize the options:
Ellipse Options
Option |
Description |
Ellipse border color |
The option allows selecting the default color of ellipse borders: click in the option row, click the ellipsis |
Ellipse border width |
The option allows selecting the default width of ellipse borders: click in the option row, highlight or delete the existing value, and then type or select a width value of your choice. The values are whole numbers from 1 through 5. |
Ellipse border style |
The option allows selecting the default style of ellipse borders: click in the option row, click the arrow |
Show ellipse in background |
The option allows selecting how to show an ellipse on a chart by default: in the background (behind the chart bars) or in the forefront (in front of the chart bars). To select, click in the
option row, click the arrow |
Ellipse background color |
The option allows selecting the default color of an ellipse background: click in the option row, click the ellipsis |
Show background |
The option allows selecting whether to show an ellipse background by default or not: click in the option row, click the arrow |
Show ellipse label |
The option allows selecting whether to show an ellipse label on a chart by default or not: click in the option row, click the arrow |
Rectangle Options
Option |
Description |
Rectangle border color |
The option allows selecting the default color of rectangle borders: click in the option row, click the ellipsis |
Rectangle border width |
The option allows selecting the default width of rectangle borders: click in the option row, highlight or delete the existing value, and then type or select a width value of your choice. The values are whole numbers from 1 through 5. |
Rectangle border style |
The option allows selecting the default style of rectangle borders: click in the option row, click the arrow |
Show rectangle in background |
The option allows selecting how to show rectangles on a chart by default: in the background (behind the chart bars) or in the forefront (in front of the chart bars). To select, click in the
option row, click the arrow |
Rectangle background color |
The option allows selecting the default color of a rectangle background: click in the option row, click the ellipsis |
Show background |
The option allows selecting whether to show a rectangle background by default or not: click in the option row, click the arrow |
Show rectangle label |
The option allows selecting whether to show a rectangle label on a chart by default or not: click in the option row, click the arrow |
To enable the modified values, click OK at the bottom of the dialog box.
 button, and then, in the
Color palette that appears, select a color of your choice.
button, and then, in the
Color palette that appears, select a color of your choice.