- On the File menu, click Options.
- Right-click in the chart, and then, in the menu that appears, click Options.
* In the FXCM Trading Station, the command is available on the System menu.
Show/hide Price Gaps
Brief
The article explains how to show or hide price gaps on a chart.
Details
A price gap occurs when the closing price of one period differs noticeably from the opening price of the immediately following period. On a chart, it looks like a break in a chain of candlesticks or bars.
Note that on Line mode charts, price gaps are not visible.
Presence or absence of price gaps on a chart affects the appearance of lines and other chart elements. Thus, it's up to you whether to show the gaps on a chart or not.
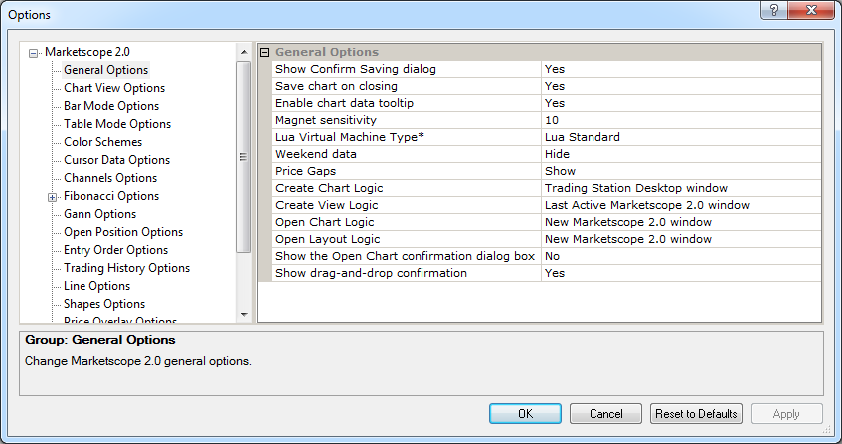
To show or hide price gaps