RSI (Relative Strength Index)
RSI (Relative Strength Index) is a momentum oscillator. Its basics were developed by J. Welles Wilder and first introduced in his book New Concepts in Technical Trading Systems in 1978.
RSI helps to monitor an instrument's price momentum or, in other words, the rate (speed) of price changes. It is believed that momentum always foreruns and influences price changes. The greater the momentum is, the faster an instrument's price changes, and the faster it changes, the stronger the price trend is. Thus, a trader can see a price trend's presence, evaluate its strength, and anticipate trend reversals.
This is achieved by comparing the average positive and negative Data Source price change values calculated over a certain number of periods. The values are calculated automatically in a special way (the mathematical formulas are provided later in the article). As a result, values in the range from 0 through 100 are obtained for each period.
On a chart, the RSI oscillator is drawn in the form of a line moving up and down within this range (0 - 100) crossing over certain fixed levels (J. Welles Wilder suggests to set the levels on the marks of 30 and 70). An instrument is oversold when the oscillator's line on its way down reaches the level of 30 or drops below it. It is overbought when RSI reaches or exceeds the level of 70. The mark of 50 is another important level of the RSI oscillator. It is a threshold above which an instrument is supposed to enjoy a growing demand, and when the oscillator's line is below the level of 50, it is experiencing a decline of demand.
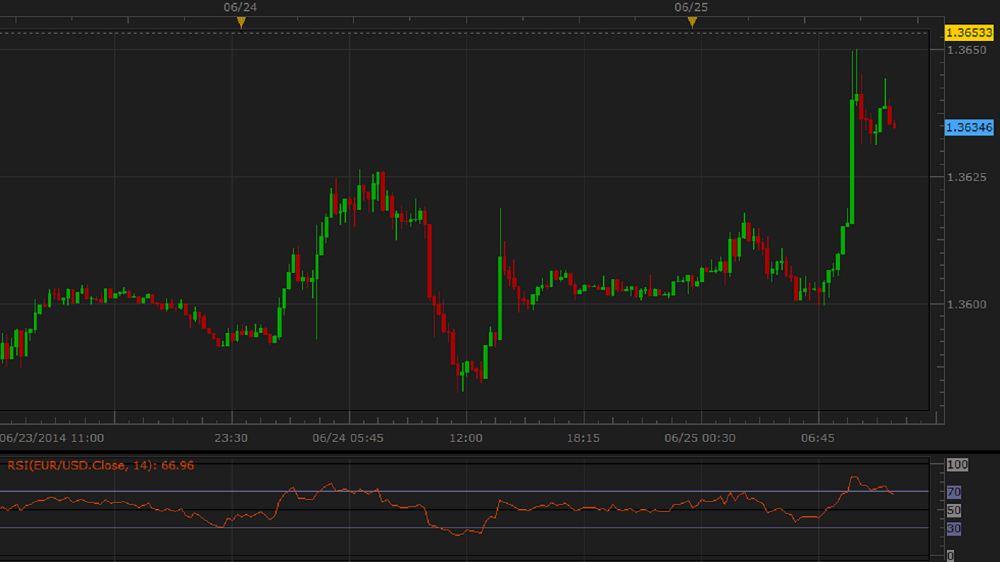
RSI is always drawn in an additional area below the market price chart.
On the following picture, you can see an example of RSI (with all its important level lines) drawn in an additional area below the chart.
Please remember that the RSI oscillator uses the historical data for its calculation, and all the information it provides belongs to the past. Indicators do not predict the market price future behavior. A trader can only suppose that the past tendencies will continue to develop in the same way for some time in the future and try to use this supposition appropriately.
As a momentum oscillator, RSI suits both ranging and trending markets, provided the trend takes on a zigzag format.
Though the oscillator employs some smoothening techniques in its calculation, the positive and negative changes of prices compensate each other and RSI does not demonstrate excessive lagging behind the market price movement.
The RSI oscillator works well in company with a bar chart and other indicators.
To apply an RSI oscillator to a chart, a trader needs to follow the procedure common to all Marketscope indicators. For more information, see the Add Indicator article.
During the procedure, a trader can customize the oscillator by specifying its parameters in the Properties dialog box. For more information, see the Change Indicator Properties article.
The parameters fall into three groups:
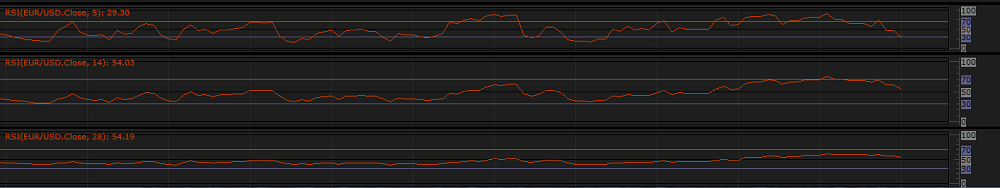
The RSI oscillator has only one Calculation parameter - Number of periods. The parameter allows to specify the number of periods, over which the oscillator is to be calculated. The possible values are from 2 through 1,000. The default value is 14. The smaller the number is, the more sensitive the oscillator becomes. Its line has a greater amplitude and crosses the Overbought and Oversold level lines more often and for a longer period of time. The greater the number is, the less sensitive the oscillator becomes. Its line has a smaller amplitude and crosses the Overbought and Oversold level lines less often and for a shorter period of time. Traders choose the Number of periods parameter's value in accordance with their need of the level of sensitivity of the oscillator. The recommended (J. Welles Wilder's default) and most commonly used value is 14.
On the following picture, you can see examples of RSI oscillators with different Number of periods parameter's values (5, 14, and 28).
The parameter is available on the Parameters tab of the RSI Properties dialog box under the Calculation heading. The RSI oscillator has several Levels' parameters:
On the following picture, you can see how RSI oscillators of different Levels parameter values (with level lines of different Overbought level and Oversold level values, widths, styles, and colors) look like on a chart.
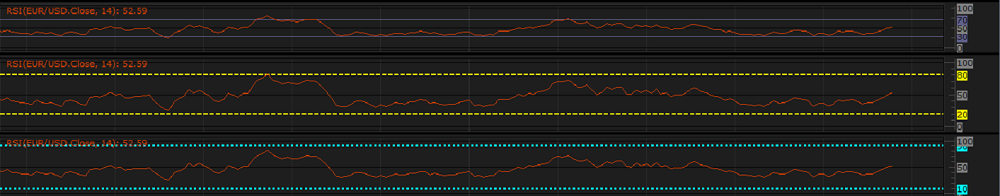
The parameters are available on the Parameters tab of the RSI Properties dialog box under the Levels heading.
Note also that the lines of the levels of 0, 50, and 100 are always of black color and cannot be modified.
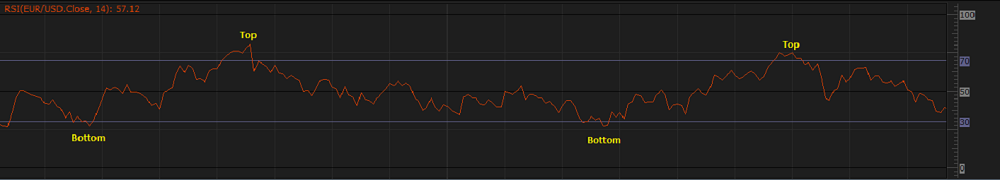
When an RSI oscillator is drawn on a chart, a trader can analyze its information and try to interpret it correctly. According to J. Welles Wilder, RSI produces the following trading signals:
On the following picture, you can see examples of the Top and Bottom signals.
Note: Instruments can stay overbought or oversold for long periods of time. Therefore, if RSI crosses the Overbought level or Oversold level, do not undertake immediate actions and wait till the line crosses the level in the opposite direction. For example, if RSI drops below 30 (J. Welles Wilder's default Oversold level), do not close Sell and open Buy positions until the line comes back above the level.
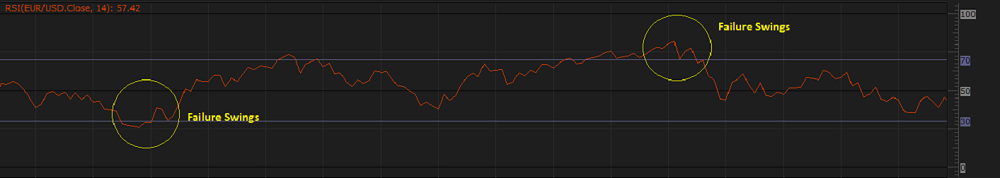
On the following picture, you can see examples of the Failure Swings signals.
On the following picture, you can see examples of the Divergence signals.
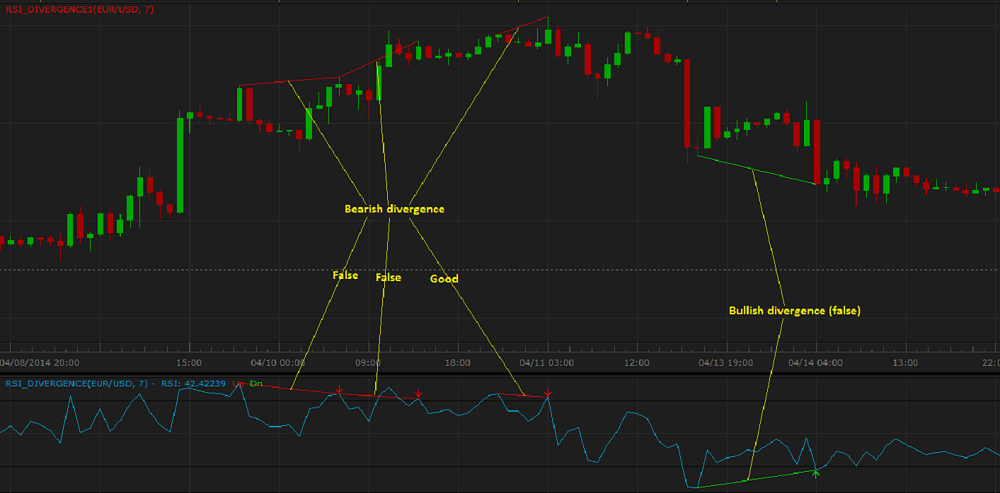
Please note that divergences are often misleading in a strong price trend: bullish (or bearish) divergences can occur in a strong downtrend (or uptrend) and yet the strong downtrend (or uptrend) continues.
Note: J. Welles Wilder mentions two more signals (Chart Formations and Support and Resistance) that are not direct trading signals. They simply signal a possible appearance of certain graphical chart formations and support and resistance lines that may soon show up on the price chart.
At the same time, many technical analysts are sure the RSI produces more trading signals:
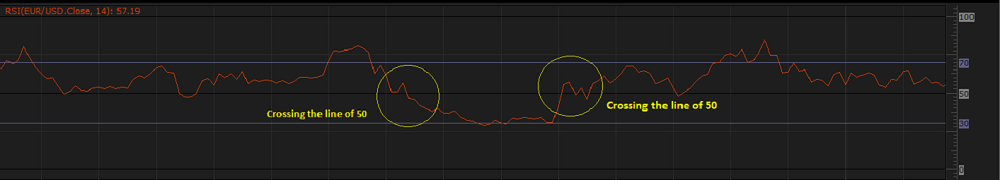
On the following picture, you can see examples of the signals of crossing the line of the mark of 50.
The RSI oscillator's values are calculated automatically using the following formulas:
RSIi = 100 - 100 / [1 + (AvgDiff(+)i / AvgDiff(-)i)]
where:
RSIi - is the Relative Strength Index value of the period being calculated.
AvgDiff(+)i - is the average price change (positive) value of the current period calculated over N number of periods.
AvgDiff(-)i - is the average price change (negative) value of the current period calculated over N number of periods.
AvgDiff(+)i = [AvgDiff(+)i-1 x (N - 1) + Diff(+)i] / N
where:
N - is the number of periods over which the oscillator is calculated.
Diff(+)i - is the price change (positive) value of the period being calculated.
Diff(+) > 0, else Diff(+) = 0.
AvgDiff(-)i = [AvgDiff(-)i-1 x (N - 1) + Diff(-)i] / N
where:
Diff(-) is the price change (negative) value of the period being calculated.
Diff(-) < 0, else Diff(-) = 0.
Diff = Pricei - Pricei-1
where:
Diff - stands for any difference (positive or negative).
Pricei - is the Data Source price of the period being calculated.
Pricei-1 - is the Data Source price of the period immediately preceding the one being calculated.