Add Horizontal Line
Brief
The article explains how to add a horizontal line to a chart.
Details
To add a horizontal line to a chart
- Select the Horizontal Line tool in one of the following ways:
- On the toolbar, click the Add Line arrow
 ,
and then click Add Horizontal Line.
,
and then click Add Horizontal Line.
To choose a drawing mode, point to Add Horizontal
Line and then click a mode of your choice.
- On the Insert menu, point to Lines, and then click Add Horizontal
Line.
- Right-click in the price values, and then click Add Horizontal Line.
- Right-click in the chart, point to Chart Elements on the shortcut menu, and
then click Add Horizontal Line.
* When a chart is opened within the FXCM Trading Station, you can also select the tool in the following way:
On the Charts menu, point to Insert, point to Lines, and then
click Add Horizontal Line.
- On the chart, click the price level, through which you want to draw a horizontal line.
The point automatically adjusts according to a selected
drawing mode if necessary.
- The Add Horizontal Line dialog box appears.
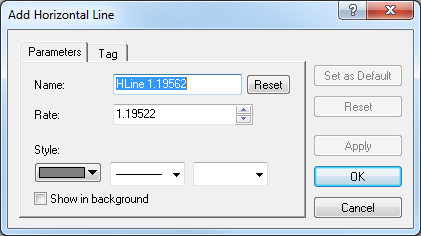
- On the Parameters tab, select line parameters of your choice:
- In the Name box, type a name of your choice.
Note: To restore the default name, click Reset.
- In the Rate box, select or type the price value, on the level of which you want to add a horizontal line.
- In appropriate Style boxes, select the line's color, style, and width of your choice.
- To show the line in background, select the Show in background check box.
Otherwise, clear the check box.
Notes:
- To apply the selected properties (except for Mame) to all horizontal lines to be added in the future by default, click Set as Default.
- To restore the factory settings, click Reset.
- To specify the line's tag parameters, click the Tag tab. The dialog box opens on the Tag tab.
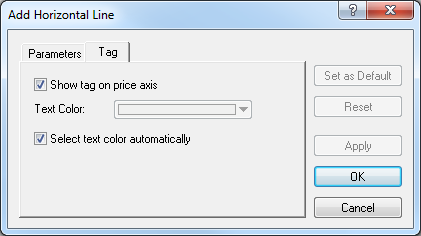
- To show the tag indicating the price level on the price axis, select the Show tag
on the price axis check box. Otherwise, clear the check box.
- To change the color of the text in the tag, in the Text Color box, select the
color of your choice.
- To select the color of texts in the tag automatically, select the Select text
color automatically check box. Otherwise, clear the check box.
Notes:
- To apply the selected properties to all horizontal lines to be added in the future by default, click Set as Default.
- To restore the factory settings for the line, click Reset.
- Click OK.
Notes: To disable the Horizontal Line tool prior to its timeout expiration (to change the time period, see the
Chart Element Options] article), do the same actions as for selecting the tool or one of the following:
- Right-click in the chart.
- Press ESC.
back