- On the File menu, click Options.
- Right-click anywhere in the chart, and then, in the menu that appears, click Options.
* In the FXCM Trading Station, the command is available on the System menu.
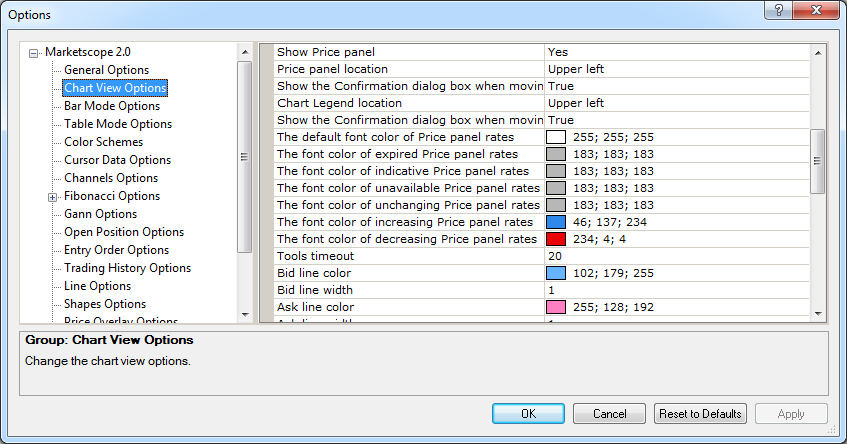
Chart Element Options
Brief
The article explains how to customize chart elements: tools, legends, labels, and lines.
Details
You can customize the appearance of chart elements in the following ways: select colors and fonts of numbers and letters, line colors, widths, and styles, as well as presence or absence of certain elements on a chart.
To customize chart elements
Price panel and Legend location options
For more information, see the Price Panel article.
Option |
Description |
Show Price panel |
The option allows showing or hiding the price panel on a chart: click in the option row, click the arrow |
Price panel location |
The option allows selecting the price panel location on the chart: click in the option row, click the arrow |
Show the Confirmation dialog box when moving the Price panels |
The option allows deactivating and activating the Confirmation dialog box appearance when moving the Price panels around open charts: click in the option row, click the arrow
|
Chart Legend location |
The option allows selecting the chart legend location on a newly-created chart: click in the option row, click the arrow |
Show the Confirmation dialog box when moving the Legends |
The option allows deactivating and activating the Confirmation dialog box appearance when moving the Legends around open charts: click in the option row, click the arrow
|
Price panel rate options
Option |
Description |
The default font color of Price panel rates |
The option allows selecting the font color of the price panel rates when the market is closed: click in the option row, click the ellipsis |
The font color of expired Price panel rates |
The option allows selecting the font color of the expired price panel rates: click in the option row, click the ellipsis
|
The font color of indicative Price panel rates |
The option allows selecting the font color of the indicative price panel rates: click in the option row, click the ellipsis
|
The font color of unavailable Price panel rates |
The option allows selecting the font color of the unavailable price panel rates: click in the option row, click the ellipsis
|
The font color of unchanging Price panel rates |
The option allows selecting the font color of the unchanging price panel rates: click in the option row, click the ellipsis
|
The font color of increasing Price panel rates |
The option allows selecting the font color of the increasing price panel rates: click in the option row, click the ellipsis
|
The font color of decreasing Price panel rates |
The option allows selecting the font color of the decreasing price panel rates: click in the option row, click the ellipsis
|
Ruler options
For more information, see the Measure Distance article.
Option |
Description |
Ruler line color |
The option allows selecting the color of the ruler line: click in the option row, click the ellipsis
|
Ruler text color |
The option allows selecting the color of the ruler text: click in the option row, click the ellipsis
|
Label options
For more information, see the Labels article.
Option |
Description |
Label text font |
The option allows selecting the font and size of the text in a chart label (a label created with the Add Label command):
click in the option row, click the arrow |
Label text color |
The option allows selecting the color of a chart label (a label created with the Add Label command) text: click in the option row, click the ellipsis
|
Label background color |
The option allows selecting the color of the background of a chart label (a label created with the Add Label command): click in the option row, click the ellipsis
|
Element label text color |
The option allows selecting the color of a chart element's label text: click in the option row, click the ellipsis
|
Element label background color |
The option allows selecting the color of the background of a chart element's label: click in the option row, click the ellipsis
|
Other element options
Option |
Description |
Tool timeout |
The option allows selecting a time span (in seconds) after which a tool is automatically disabled: click in the option row, highlight or delete the existing value, and then type a value of your choice. The value is any whole number. |
Fade out orders/positions |
The option allows fading out all orders and positions that are not associated with the selected order or position: click in the
option row, click the arrow |
Show current value |
The option allows showing or hiding the current value of an indicator's price or tick volume in the chart legend: click in the option row,
click the arrow |
To enable the modified values, click OK at the bottom of the dialog box.
 button, and then, in the Color palette that appears, select a color of your choice.