Show Tick Volume
Brief
The article explains how to show and hide the tick volume of a symbol on the main chart or a price overlay.
Details
The tick volume shows how many ticks (or changes of price) have taken place during a chart period. To move the price one way or another, a certain number of trades must take place, and the tick volume reflects this number and gives a trader a chance to evaluate the market activity.
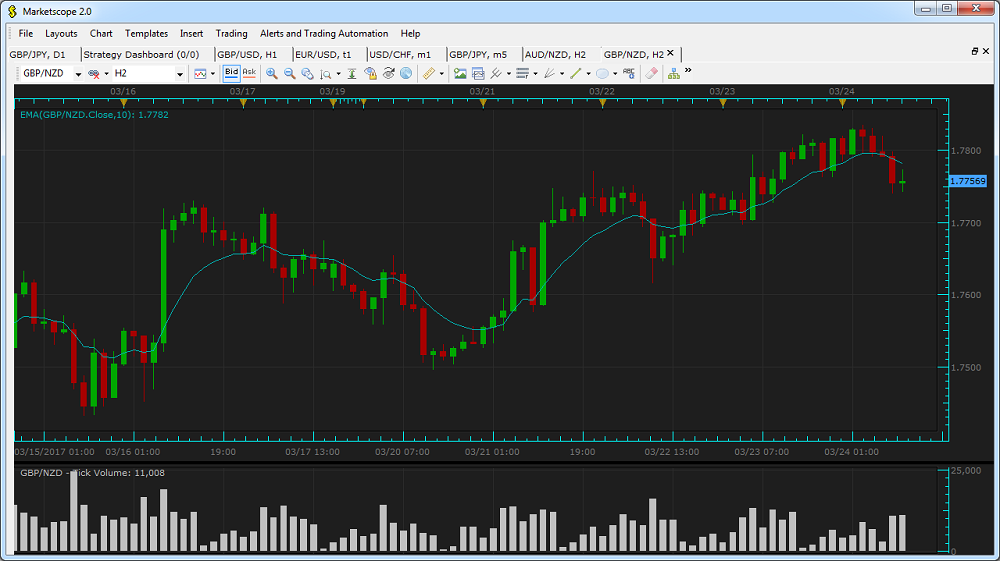
In Marketscope, the tick volume is provided for the current symbol of the main chart and symbols of price overlays. By default, the tick volume is hidden.
To show the tick volume
The current volume value is shown in the legend of the area. You can hide the value and then show it in the legend again by setting the Show current value option of the Options dialog box to No or Yes respectively. For more information, see the Chart Element Options article.
The tick volume data is saved as Indicore SDK data. If the tick volume is shown, the volume data is also displayed in the table mode and in the Cursor Data window, and saved to Excel.
You can navigate the tick volume area in the same way as any other chart and add chart elements.
To hide the tick volume chart, right-click in the chart and then click Hide Tick Volume.