About Indicators
Brief
The article explains what indicators are in general and introduces their basics.
Details
Success in trading comes when a trader knows the market and understands its behavior. To achieve this goal, a trader needs to analyze the market. In the process of market analysis, a trader studies the market
data and different factors influencing its behavior. These factors can be global, coming from outside of the market, and internal, happening inside the market itself. Depending on what factors are being
analyzed, analysts recognize two major forms of market analysis:
- Fundamental analysis is an analysis of various global factors that may influence the market behavior: economical (such as statistical reports on the economy state), political (major political
events), social (unemployment rate growth), etc.
- Technical analysis is an analysis that takes into account the assumption that all relevant information and fundamental factors are already reflected in the market prices, therefore, it analyzes
the market data for detecting the market trends and predicting its future behavior.
A trader has a variety of instruments to use for technical analysis of the market. They include different data tables, price charts, price overlays, lines, signs, and other chart elements.
One of the most widely used instruments of the market technical analysis is an indicator. It transforms the market data into its own values for a trader to assess. In the process of transformation, some data
sources undergo certain manipulations resulting in certain outputs. Being applied to a chart, indicators smoothen market noises, indicate trends and their strength and momentum, provide support and
resistance levels, and help predicting possible points of market movement reversals. All this information allows a trader to make informed trading decisions.
In Forex, indicators analyze the historic market data (the past and current prices) and numerous factors of its formation. A single indicator cannot comprise all of these factors. Therefore, each indicator
deals with one, two, or several such factors. For a given market situation, those indicators are good that deal with the factors that produce effect on the market behavior at the moment. The indicators that
deal with the factors that have nothing to do with the current market behavior are bad for the given market situation and should not be used. When an appropriate indicator (or a combination of indicators as
the market factor situation may require) is used, a trader gets good enough results to interpret.
The historic market data and numerous factors of its formation provide data sources for an indicator calculation. It can be such data as tick prices (where a tick is each and every market price
change). The price changes almost always when a new deal appears on the market. This produces overwhelming in number and volatile in nature data that is extremely difficult to present and almost impossible to
perceive. To solve the problem, the market prices are very often aggregated into an OHLC bar. In other words, instead of providing all numerous prices of a bar period, only Open that is
the first or opening price of the bar, High - the highest price of the bar, Low - the lowest price of the bar, and Close - the last or closing price of the bar are
displayed. These four prices form an OHLC bar.
The OHLC bar periods are time spans the trading time is 'cut' in to. They must be of equal duration for every bar on a particular chart. The common set of periods includes one minute, five minutes, 15
minutes, 30 minutes, one hour, two hours, three hours, four hours, six hours, eight hours, one day, one week, and one month.
Please note that in Forex, a trading day starts at a different time than a calendar day starts. For example, an FXCM (and many other U.S. Forex brokers) trading day starts at 5:00 P.M. New York Time or EST.
This is the moment when the market closes and opens again. All periods are calculated with the reference to this moment. In other words, they start to 'cut' the periods at 5.00 P.M. New York Time.
For example, a one-minute period can start only at 5:00, 5:04, 5:17, etc., and not at 5:00:01, 5:05:15, 5:17:47, etc.; a 15-minute period can start only at 5:00, 5:15, 5:30, etc., and not at 5:02, 5:11,
5:27, etc.; a one-hour period can start only at 5:00, 6:00, 11:00, etc., and not at 5:01, 6:25, 11:41, etc. A week period starts when the market opens after a weekend on Sunday at 5:00 P.M. New York Time.
Note also that minute periods are multiple to an hour (one hour contains 60 minutes, and 60 can be divided by 1, 5, 15, or 30 that are minute periods), and hour periods are multiple to a day (a day contains
24 hours, and 24 can be divided by 1, 2, 3, 4, 6, and 8 that are hour periods).
Another data source of an indicator can be Volume that is the number of ticks in one period.
An indicator data sources may include prices calculated on the basis of OHLC bar price combinations. These prices are:
- Median price is an average of the High and Low prices of a period and is calculated as the sum of (High + Low) divided by 2.
- Typical price is an average of the High, Low, and Close prices and is calculated as the sum of (High + Low + Close) divided by 3.
- Weighted price is an average of the High, Low, and double Close prices and is calculated as the sum of (High + Low + 2xClose) divided by 4.
Different indicators use various data sources. Some indicators use only one price: Open, High, Low, Close, Median, Typical, or Weighted. They are called One-price indicators. Others use the
whole bar as a data source. They are called OHLC-bar indicators.
The indicator data sources undergo manipulations in accordance with a certain sequence of steps or set of rules called an algorithm. Some indicator algorithms are mathematical formulas.
With the help of these algorithms or formulas, indicators transform the data sources into their own values called an output or result (some indicators produce more than one result). The
results can be presented as a set of numbers in a table that is easier to interpret than regular prices. For greater convenience of analyzing, the results can be presented graphically in the form of lines,
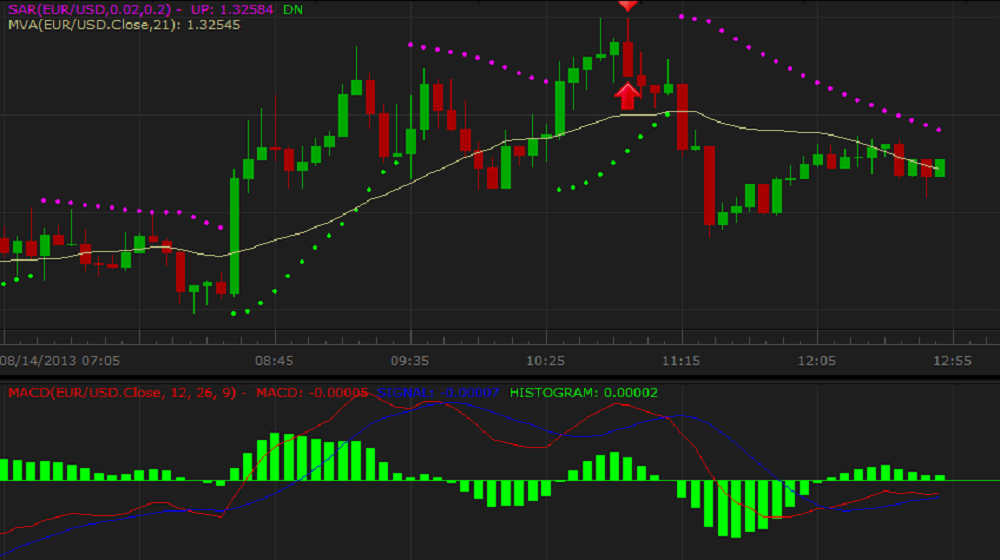
dots, signs, figures, and histograms. On the following picture, you can see the MVA, SAR, and MACD indicators graphically presented as a line, dots, and a histogram in an additional area below the chart
respectively.
A trader can customize an indicator calculation with the help of parameters. By specifying their values, a trader determines what calculation results the indicator produces and how the results are reflected
on the chart.
Different parameters define different aspects of an indicator's presentation:
- The Calculation parameters determine the way an indicator is calculated. For example, in Marketscope, the Number of periods parameter specifies the number of periods, over which
an indicator is to be calculated. Different indicators have different ranges of the parameter's values (from 1, 2, 3 through 1,000, 10,000, or any greater number up to the number of available periods
on a chart that can be millions). The smaller the number of periods is, the faster the reaction of the indicator to the price changes and closer the indicator's line to the market prices is. The
greater the number is, the slower the reaction of the indicator to the price changes and farther the indicator's line from the market prices is.
- The Style and Appearance parameters determine the way an indicator is drawn on a chart.
Very broadly, indicators fall into three major categories:
- Trend indicators help to identify and forecast market trends of price movement directions and points of their possible reversals.
- Volume indicators evaluate the market activity by analyzing the volume of trades on the market. In Forex, the output data of volume indicators can also be used as an additional data source for
other indicators.
- Oscillators reflect changes of price momentum banded between two extreme values or fluctuating above and below the zero line. Oscillators are always drawn in additional areas.
The market prices are unpredictable by definition. Therefore, when drawn on a chart, they move erratically frequently producing sharp rises and falls called noises. By averaging the prices, an
indicator smooths these noises and presents the prices graphically that makes seeing the market trends easier.
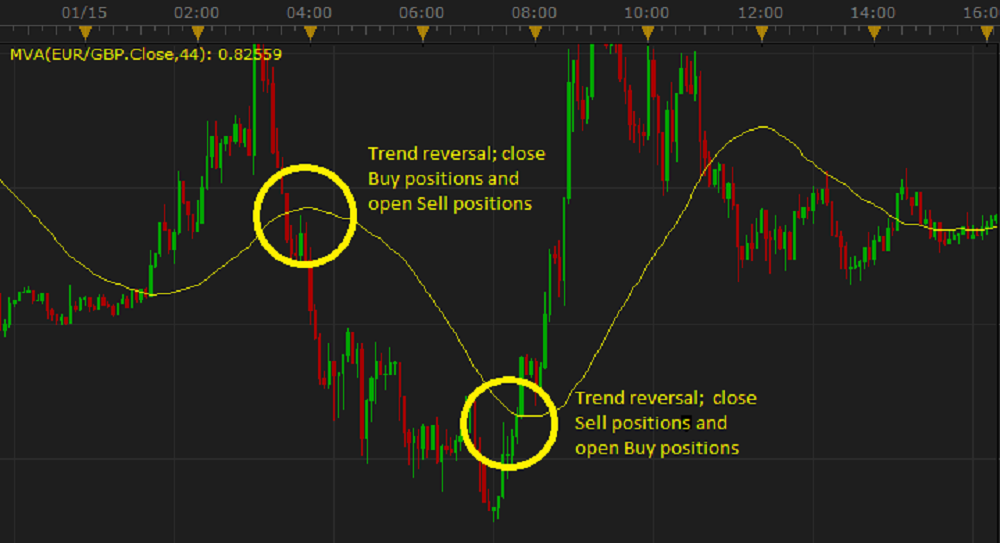
Another important feature of an indicator is its ability to produce certain signals that help a trader to make trading decisions. A stable upward or downward trend can be a signal for opening buy or sell
positions respectively. A horizontal price movement suggests waiting for a trend to appear without any trading actions. Crossing of the indicator's line by the market prices from above or below can be a
signal a trend reversal and the necessity of opening or closing trading positions. The following picture shows how the signals look like on a chart.
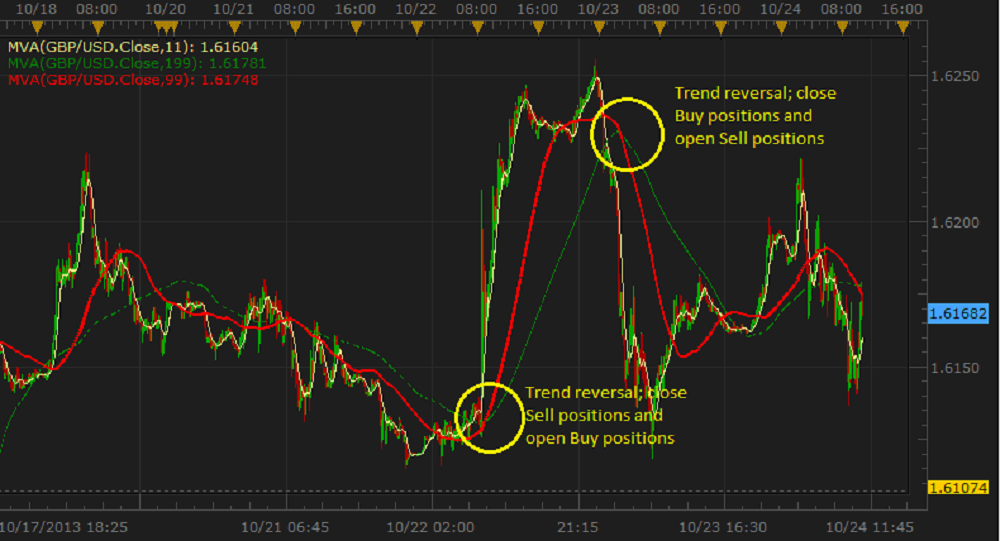
An interaction of lines of two or more indicators applied to one and the same chart produce similar signals. The following picture
shows how the signals look like on a chart.
Indicators serving as support and resistance levels as well as strength and momentum indicators produce their own signals. For more information, read the
articles about the indicators of your interest.
back