AROON (Aroon)
AROON (Aroon) is a unique indicator system developed by Tushar Chande and presented in the September 1995 issue of the Stocks & Commodities magazine.
It is unique because, unlike the majority of indicators that operate with the market prices, AROON operates with time periods. AROON helps detecting the presence of a market price trend, its direction and
strength.
For these purposes, AROON determines the number of periods since an instrument's price recorded an N-day highest and lowest values. Its values are calculated automatically for every period (the calculation
formulas are provided later in the article).
On a chart, AROON is drawn in the form of two lines. One line is for values calculated (on a percentage basis) with the number of periods since an instrument's price recorded an N-day highest price
(Up Line), and the other is calculated with the number of periods since an N-day lowest price (Down Line). The lines fluctuate within the range from 0 through 100. Immediately after a new
N-day highest or lowest price is reached, AROON registers its maximum value and the corresponding (Up or Down line) surges to 100. The line declines as the elapsed number of periods since the new highest
or lowest price increases. It reaches 0 when the elapsed number of periods is 25.
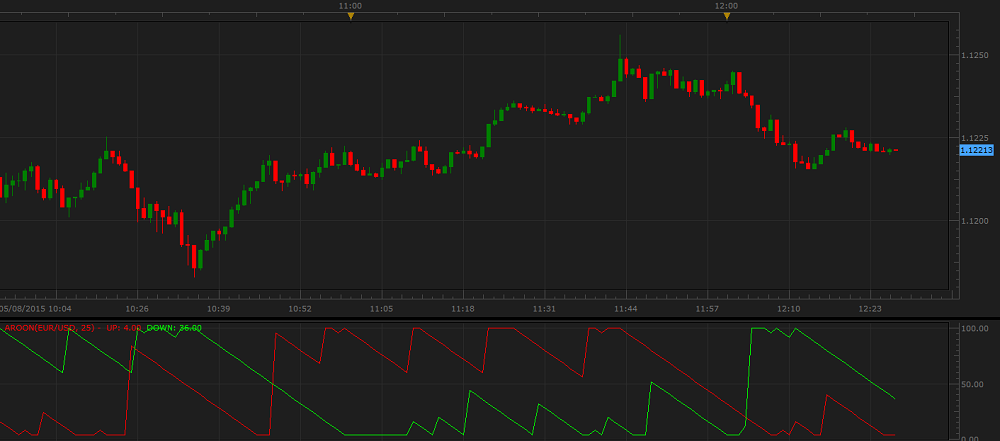
As all oscillators, AROON is always drawn in an additional area below the market price chart.
On the following picture, you can see an example of AROON.
Note that AROON uses the data that belongs to the past and does not predict the market price future
behavior. A trader can only suppose that the past tendencies will continue to develop in the same way for
some time in the future and try to use this supposition appropriately.
To apply an AROON oscillator to a chart, a trader needs to follow the procedure common to all Marketscope
indicators. For more information, see the Add Indicator article.
During the procedure, a trader can customize the indicator by specifying its parameters in
the Properties dialog box. The parameters fall into two groups:
- Calculation - the parameters needed to calculate an indicator's prices.
- Style and Appearance - the parameters needed to specify the way an indicator appears on a chart.
For more information, see the Change Indicator Properties article.
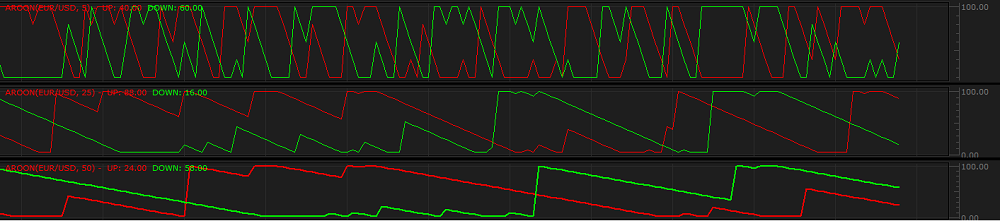
AROON has only one Calculation parameter - Number of periods. The parameter allows to specify
the number of periods, over which the indicator is to be calculated. The possible values are from 3
through 1,000. The default value is 25. The smaller the number is, the faster the oscillator reacts
to the market price changes. Its line looks tighter and changes its direction more frequently. The greater
the number is, the slower the oscillator reacts to the price changes. Its line looks more expended and
changes its direction less frequently. Traders choose the Number of periods parameter's value in
accordance with their trading tasks, strategies, and techniques. The most commonly used value is the default
one - 25.
On the following picture, you can see examples of AROON drawn with different Number of periods
parameter's values.
The parameter is available on the Parameters tab of the AROON Properties dialog box under the
Calculation heading.
The oscillator's Style parameters are:
- Up Line color - the parameter allows to specify the color of the oscillator's Up Line.
- Up Line width - the parameter allows to specify the width of the oscillator's Up Line.
- Up Line style - the parameter allows to specify the style of the oscillator's Up Line.
- Down Line color - the parameter allows to specify the color of the oscillator's Down Line.
- Down Line width - the parameter allows to specify the width of the oscillator's Down Line.
- Down Line style - the parameter allows to specify the style of the oscillator's Down Line.
The parameter is available on the Parameters tab of the AROON Properties dialog box under the
Style heading.
When an AROON oscillator is drawn on a chart, a trader can analyze its information and try to interpret it
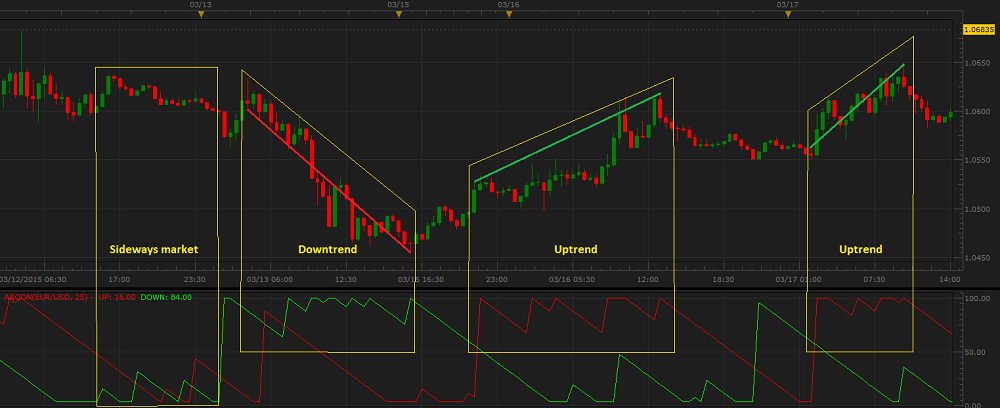
correctly. According to Chande, AROON produces the following trading signals:
- Uptrend presence and strength - the situation when the Up Line is moving upwards and above
the level of 50, and the Down Line is heading downwards and below 50 indicates an uptrend presence.
The Up Line being above the level of 70 while the Down Line being below 30 indicates a strong
uptrend. Thus, consider opening of Buy positions and closing of Sell ones.
- Downtrend presence and strength - the situation when the Down Line is moving upwards and above
the level of 50, and the Up Line is heading downwards and below 50 indicates a downtrend presence.
The Down Line being above the level of 70 while the Up Line being below 30 indicates a strong
downtrend. Thus, consider opening of Sell positions and closing of Buy ones.
- Trend reversal - the signal occurs when one of the lines stays for a noticeable time within the range
of 0 - 30, and the other one within the range of 70 - 100 and then the situation flips: the lines move
towards each other, cross over, and the former bottom line surges towards the level of 100, while the
former upper one remains relatively low. Consider opening of positions in the direction of emerging trend
and closing of ones in the opposite direction.
- Sideways market - the situation when the two lines are below 50 and/or moving lower in close proximity
indicates the presence of a sideways market, and it is advised to refrain from trading activity.
On the following picture, you can see examples of AROON trading signals.
Note that the indicator operates with extreme prices and neglects less significant ones. As a result, it
often lags behind price changes. Thus, use other indicators to confirm or deny AROON trading signals.
For example, use a momentum oscillator to identify oversold levels when a 25-weeks Aroon indicator signals
an uptrend presence.
The Aroon indicator's values are calculated using the following formulas:
Up Line = ((N - Periods since N-day H) / N) x 100
Down Line = ((N - Periods since N-day L) / N) x 100
where:
Up Line - the Aroon value of the line calculated with the number of periods since an instrument's
price recorded an N-days highest price.
Down Line - the Aroon value of the line calculated with the number of periods since an instrument's
price recorded an N-days lowest price.
N - the N-days highest price.
L - the N-days lowest price.
back