DIRECTIONAL_REAL_VOLUME (Directional Real Volume)
DIRECTIONAL_REAL_VOLUME (Directional Real Volume) is a volume oscillator that has been developed by FXCM for technical analysis in forex trading. It is the most powerful and diverse indicator of all other
indicators of the Trading Activity group of Marketscope. Besides the total volume of all FXCM trades in an instrument during a given period, as the Real Volume indicator does,
it allows monitoring the volumes of Buy and Sell trades as well as the Net volume.
For these purposes, DIRECTIONAL_REAL_VOLUME retrieves all the data from the trading server for every period. The value of the Net Volume is calculated as the difference of between the Buy and Sell
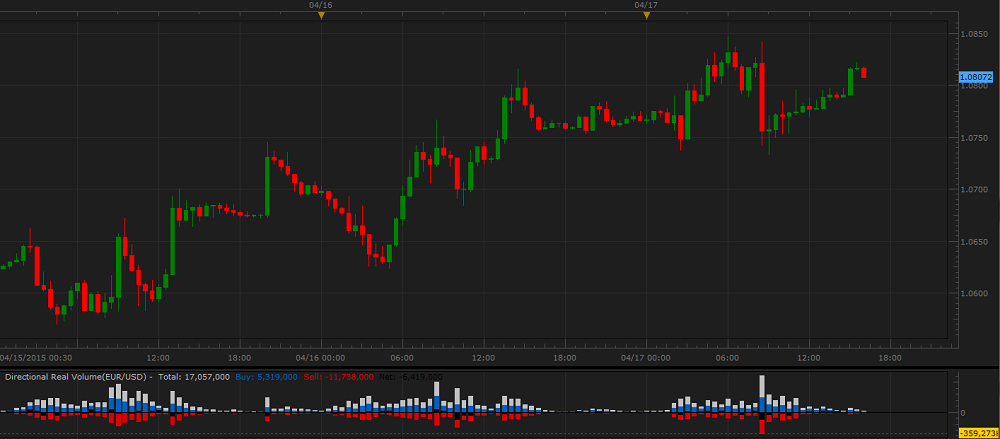
volumes. On a chart, DIRECTIONAL_REAL_VOLUME is drawn in the form of a histogram with bars of different color above and below the zero line. The bars reflecting different volumes of one period overlap each
other. The taller a bar is, the greater its value is.
As all oscillators, DIRECTIONAL_REAL_VOLUME is always drawn in an additional area below the market price chart.
On the following picture, you can see an example of DIRECTIONAL_REAL_VOLUME drawn in an additional area below the market price chart.
Please notice that DIRECTIONAL_REAL_VOLUME uses the data that belongs to the past and does not predict the market price future behavior. A trader can only suppose that the past tendencies will continue to
develop in the same way for some time in the future and try to use this supposition appropriately.
The oscillator is not used as a stand-alone oscillator. It works best in conjunction with a market price chart and some other indicators as a support tool of their trading signals.
To apply a DIRECTIONAL_REAL_VOLUME oscillator to a chart, a trader needs to follow the procedure common to all Marketscope indicators. For more information, see the
Add Indicator article.
During the procedure, a trader can customize an oscillator by specifying its parameters in the Properties dialog box. For more information, see the
Change Indicator Properties article.
The Parameters properties fall into three groups: Options, Style, and Appearance.
The oscillator's Options parameters are:
- Show net volume - the parameter allows selecting whether the Net volume of trades is to be displayed or not. The values are No and Yes. The default value is No.
- Show Total volume - the parameter allows to selecting whether the Total volume of trades is to be displayed or not. The values are No and Yes. The default value is No.
The oscillator's Style parameters are:
- Color of Buy bars - the parameter allows selecting the color of the oscillator's bars representing the volume of Buy trades, and it works as the Lines color parameter listed under
the Style heading on the Parameters tab of an indicator's Properties dialog box.
- Width of Buy bars - the parameter allows selecting the width of the oscillator's bars representing the volume of Buy trades. The parameter's values are from 1 through 100. The default
value is 100.
- Color of Sell bars - the parameter allows selecting the color of the oscillator's bars representing the volume of Sell trades, and it works as the Lines color parameter listed
under the Style heading on the Parameters tab of an indicator's Properties dialog box.
- Width of Sell bars - the parameter allows selecting the width of the oscillator's bars representing the volume of Sell trades. The parameter's values are from 1 through 100. The default
value is 100.
- Color of Net bars - the parameter allows selecting the color of the oscillator's bars representing the Net volume of trades, and it works as the Lines color parameter listed under
the Style heading on the Parameters tab of an indicator's Properties dialog box.
- Width of Net bars - the parameter allows selecting the width of the oscillator's bars representing the Net volume of trades. The parameter's values are from 1 through 100. The default
value is 100.
- Color of Total bars - the parameter allows selecting the color of the oscillator's bars representing the Total volume of trades, and it works as the Lines color parameter listed
under the Style heading on the Parameters tab of an indicator's Properties dialog box.
- Width of Total bars - the parameter allows selecting the width of the oscillator's bars representing the Total volume of trades. The parameter's values are from 1 through 100. The default
value is 100.
The oscillator's Appearance parameters are:
- Drawing Mode - the parameter allows selecting a drawing mode parameter. The values are Open-to-Open, Close-to-Close, and
Middle-to-Middle.
- Show label - the parameter allows showing and hiding an indicator's label. The parameters are Yes and No.
- Show legend - the parameter allows showing and hiding an indicator's legend. The values are Yes and No.
- Show in background - the parameter allows showing an indicator in the background behind the prices or in the foreground in front of the prices. The values are Yes and No.
The oscillator produces no direct trading signals, but, when it is drawn on a chart, its data can help in understanding the market behavior and applying appropriate trading strategies.
The oscillator's values are obtained automatically from the trading server.
The Net volume is calculated as the difference between the Buy and Sell volumes. The positive values are drawn as bars above the zero line, and the negative ones - as bars below the zero
line.
back