and a regular candlestick chart.
HA works well enough on its own but can be used in combination with the market price chart and other indicators.
HA (Heikin-Ashi Chart)
HA (Heikin-Ashi Chart) is an indicator developed in Japan in 1990s. Heikin-Ashi means average bar in Japanese. It looks very much alike a regular candlestick chart, but due to the difference of the candles' appearance, it is treated by traders more as an indicator than as another chart mode.
HA is intended to present trends and their reversal points more clearly.
For the purpose, HA filters out the market fluctuations (noises) by employing average values in calculation of its bar prices.
In candlestick charts, each bar is formed by four prices of a period: Open, High, Low, and Close (OHLC bar), whereas, the Heikin-Ashi technique uses some averaged values of immediately preceding and current
periods (the formulas are provided later in the article). As a result, many extreme values are leveled, and the chart looks smoother and crisper. Note that HeikinAshi Chart can be drawn both on the market
price chat and in an additional area below it.
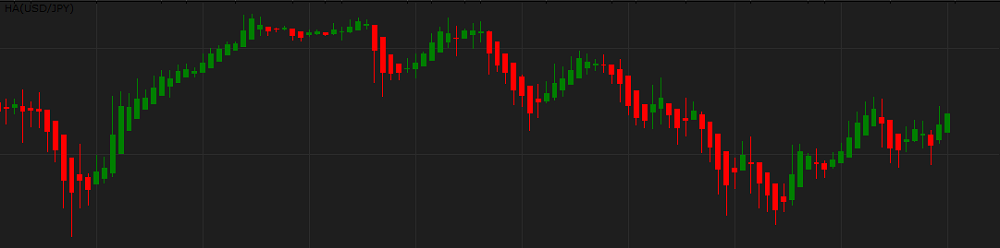
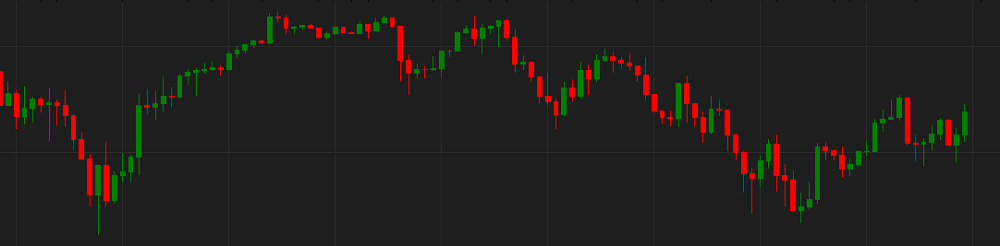
On the following pictures, you can see examples of a Heikin-Ashi indicator.
and a regular candlestick chart.
HA works well enough on its own but can be used in combination with the market price chart and other indicators.
Due to the fact that HA employs previous period's prices, its current period's prices are used with some delay. It results in HA's slight lagging behind the market prices.
To apply an HA chart, a trader needs to follow the procedure common to all Marketscope indicators. For more information, see the Add Indicator
article.
During the procedure, a trader can customize an HA chart's appearance by specifying its parameters on the Parameters tab of the HA Properties dialog box. HA has only one parameter group - Appearance parameters.
For more information, see the Change Indicator Properties article.
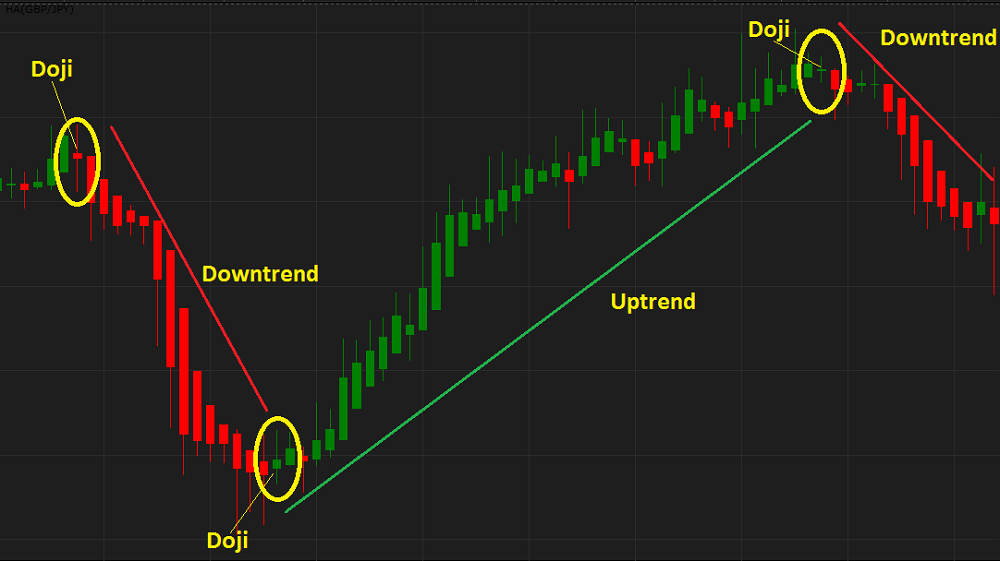
When an HA chart is drawn, a trader can analyze it and try to spot the following trading signals:
On the following picture, you can see examples of Heikin-Ashi trading signals.
The Heikin-Ashi chart values are calculated using the following formulas:
Openi = (Openi-1 + Closei-1) / 2
High = the highest value of High, Open, and Close
Low = the lowest value of Low, Open, and Close
Close = (Open + High + Low + Close) / 4
where:
Openi - is the Open price value of the period being calculated.
Openi-1 - is the Open price value of the period immediately preceding the current period.
Closei-1 - is the Close price value of the period immediately preceding the current period.
High - is the High price value of the period being calculated.
Low - is the Low price value of the period being calculated.
Close - is the Close price value of the period being calculated.