ICH (Ichimoku)
ICH (Ichimoku) is a complex indicator. It is also known as Ichimoku Kinko Hyo (equilibrium or balance at a glance chart - with one look at a chart with ICH drawn on it, a trader can see a complete picture
of the market setup) or Ichimoku Kumo (Ichimoku Cloud). The indicator was developed by Goichi Hosoda, a Japanese journalist, and presented in his 1968 book.
ICH helps detecting a price trend's presence, direction, and strength, monitoring the trend's momentum, as well as defining support and resistance levels.
For these purposes, the indicator calculates an array of values (the mathematical formulas are provided later in the article). On a chart, the indicator is drawn in the form of multiple lines (one for each
value):
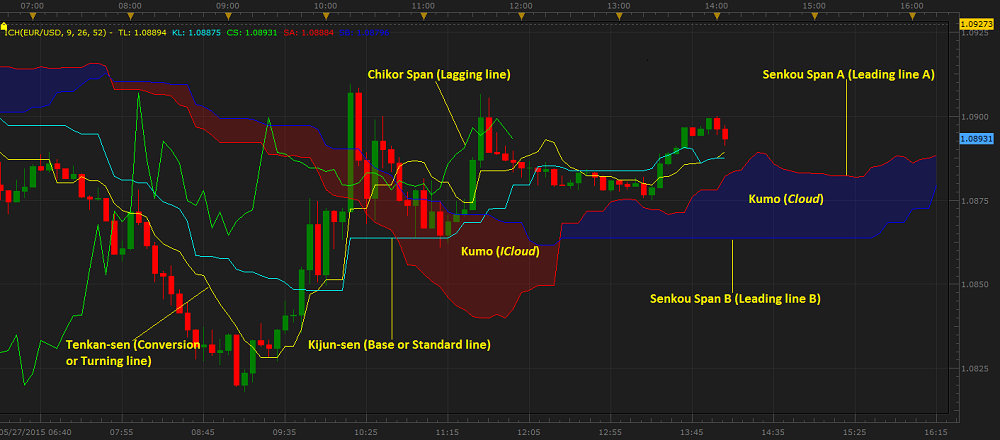
- Tenkan-sen - (Conversion or Turning line) is the midpoint of the highest and lowest prices of an N-period time frame. N is specified by the Tenkan-sen period parameter's value.
Goichi Hosoda strongly recommended to stick to the default value - 9 to avoid the system's going out of balance. Tenkan-sen moves close to the price bars smoothening the market noises
and showing the price trend more clearly. The steepness of the line reflects the momentum of the price trend: the steeper the line is, the stronger the trend's momentum is, and vice versa.
- Kijun-sen - (Base or Standard line) is the midpoint of the highest and lowest prices of an N-period time frame. N is specified by the Kijum-sen period parameter's value. Goichi Hosoda
strongly recommended to stick to the default value - 26 to avoid the system's going out of balance. Kijun-sen moves in the same way as Tenkan-sen, but, because of its being
calculated over a longer time frame, it stays further away from the price bars and smoothens more market noises, thus, showing the price trend more reliably. The steepness of the line reflects the
strength of the price trend's momentum: the steeper the line is, the stronger the trend's momentum is, and vice versa.
- Senkou Span A - (Leading line A) is the midpoint of the Tenkan-sen and Kijun-sen values. It is referred to as "Leading" because its values are plotted N periods ahead of the
current period. N is specified by the Kijum-sen period parameter's value.
- Senkou Span B - (Leading line B) is the midpoint of the highest and lowest prices of an N-period timeframe. Goichi Hosoda strongly recommended to stick to the default value - 52 to avoid
the system's going out of balance. It is referred to as "Leading" because its values are plotted N periods ahead of the current period. N is specified by the Kijum-sen period parameter's value.
The area between Senkou Span A and Senkou Span B lines is called Kumo that means Cloud. When Senkou Span A (Leading line A) is above Senkou Span B (Leading line B), Kumo
(Cloud) is blue (by default) and indicates an uptrend presence. Conversely, when Senkou Span A (Leading line A) is below Senkou Span B (Leading line B), Kumo (Cloud) is red (by default)
and indicates a downtrend presence. The Kumo (Cloud) boundaries can be treated as future support and resistance levels, with the top boundary indicating the first level of support and the bottom one
indicating the second level when the price bars are above Kumo (Cloud). Conversely, the bottom boundary indicates the first level of resistance and the top one indicates the second level when the price
bars are below Kumo (Cloud).
The thickness of Kumo (Cloud) reflects the level of the market volatility, as well as the strength of support or resistance levels. A thicker Kumo (Cloud) indicates a greater market volatility and
stronger support or resistance levels, and vice versa.
- Chikou Span (Lagging line) is the closing price of the current period plotted N periods behind it. N is specified by the Kijum-sen period parameter's value. The Chikou Span is
considered to be useful for confirmation of other Ichimoku elements' indications, such as a trend's presence, direction, and momentum strength.
On the following picture, you can see an example of ICH drawn on a price chart.
Please remember that as its Data Source the indicator uses the historical data and provides the information that belongs to the past. A trader can only suppose that the market situation will continue to
develop in the same way for some time in the future and try to use the supposition appropriately.
The indicator can be used in conjunction with other technical analysis tools, such as trend-following and momentum indicators.
To apply an ICH indicator to a chart, a trader needs to follow the procedure common to all Marketscope indicators. For more information,
see the Add Indicator article.
During the procedure, a trader can customize an indicator by specifying its parameters in the Properties dialog box. For more information, see the Change Indicator Properties
article.
The parameters fall into two groups:
- Calculation - the parameters needed to calculate an indicator's prices.
- Style and Appearance - the parameters needed to specify the way an indicator appears on a chart.
ICH has the following Calculation parameters:
- Tenkan-sen period - the parameter allows to specify the number of periods, over which the Tenkan-sen line's values are to be calculated. The possible parameter's values are from 1
through 10,000. The default value is 9. It is strongly recommended to stick to this value to avoid the indicator's going out of balance.
- Kijun-sen period - the parameter allows to specify the number of periods, over which the Kijun-sen line's values are to be calculated. The possible parameter's values are from 1
through 10,000. The default value is 26. It is strongly recommended to stick to this value to avoid the indicator's going out of balance.
- Senkou Span B period - the parameter allows to specify the number of periods, over which the Senckou Span B line's values are to be calculated. The possible parameter's values are
from 1 through 10,000. The default value is 52. It is strongly recommended to stick to this value to avoid the indicator's going out of balance.
The parameters are available on the Parameters tab of the ICH Properties dialog box under the Calculation heading.
The ICH indicator has the following Style parameters:
- Tenkan-sen color - the parameter allows to specify the color of the Tenkan-sen line, and it works as a regular Line color parameter.
- Tenkan-sen width - the parameter allows to specify the width of the Tenkan-sen line, and it works as a regular Line width parameter.
- Tenkan-sen style - the parameter allows to specify the style of the Tenkan-sen line, and it works as a regular Line style parameter.
- Kijun-sen color - the parameter allows to specify the color of the Kijun-sen line, and it works as a regular Line color parameter.
- Kijun-sen width - the parameter allows to specify the width of the Kijun-sen line, and it works as a regular Line width parameter.
- Kijun-sen style - the parameter allows to specify the style of the Kijun-sen line, and it works as a regular Line style parameter.
- Chinkou Span color - the parameter allows to specify the color of the Chinkou Span line, and it works as a regular Line color parameter.
- Chinkou Span width - the parameter allows to specify the width of the Chinkou Span line, and it works as a regular Line width parameter.
- Chinkou Span style - the parameter allows to specify the style of the Chinkou Span line, and it works as a regular Line style parameter.
- Senkou span A color - the parameter allows to specify the color of the Senkou span A line, and it works as a regular Line color parameter.
- Senkou span A width - the parameter allows to specify the width of the Senkou span A line, and it works as a regular Line width parameter.
- Senkou span A style - the parameter allows to specify the style of the Senkou span A line, and it works as a regular Line style parameter.
- Senkou span B color - the parameter allows to specify the color of the Senkou span B line, and it works as a regular Line color parameter.
- Senkou span B width - the parameter allows to specify the width of the Senkou span B line, and it works as a regular Line width parameter.
- Senkou span B style - the parameter allows to specify the style of the Senkou span B line, and it works as the a regular style parameter.
- Cloud transparency, % - the parameter allows to specify the degree of Kumo (Cloud) transparency in per cent. The possible parameter's values are from 0 through 100. The default value
is 80.
The parameters are available on the Parameters tab of the ICH Properties dialog box under the Style heading.
When an ICH indicator is drawn on a chart, a trader should analyze the information of all its elements as a whole and try to interpret it correctly. ICH produces the following trading signals:
- Trend Presence
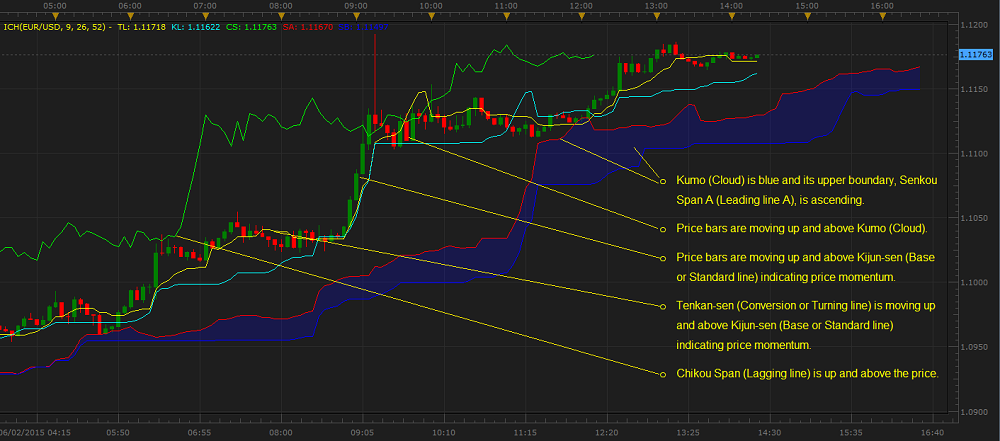
An uptrend presence is indicated by the following signals:
- Kumo (Cloud) is blue and its upper boundary, Senkou Span A (Leading line A), is ascending.
- Price bars are moving up and above Kumo (Cloud).
- Price bars are moving up and above Kijun-sen (Base or Standard line) indicating price momentum.
- Tenkan-sen (Conversion or Turning line) is moving up and above Kijun-sen (Base or Standard line) indicating price momentum.
- Chikou Span (Lagging line) is up and above the prices.
On the following picture, you can see examples of ICH uptrend signals.
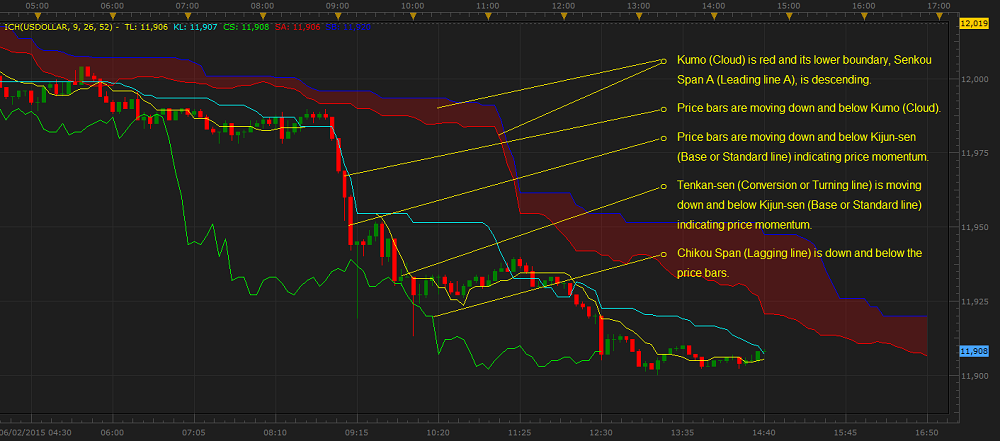
A downtrend presence is indicated by the following signals:
- Kumo (Cloud) is red and its lower boundary, Senkou Span A (Leading line A), is descending.
- Price bars are moving down and below Kumo (Cloud).
- Price bars are moving down and below Kijun-sen (Base or Standard line) indicating price momentum.
- Tenkan-sen (Conversion or Turning line) is moving down and below Kijun-sen (Base or Standard line) indicating price momentum.
- Chikou Span (Lagging line) is down and below the price bars.
On the following picture, you can see examples of ICH downtrend signals.
- Sideways Market Presence
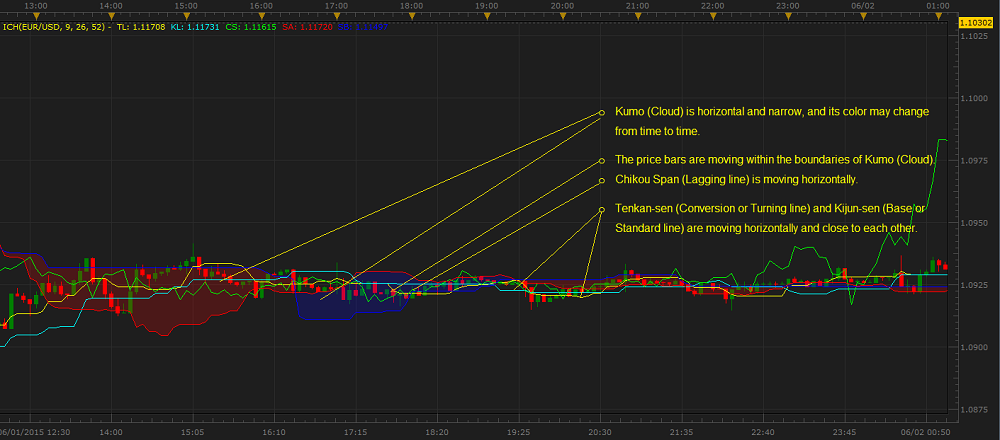
A sideways market is indicated by the following signals:
- Kumo (Cloud) is horizontal and narrow, and its color may change from time to time.
- The price bars are moving within the boundaries of Kumo (Cloud).
- Chikou Span (Lagging line) is moving horizontally.
- Tenkan-sen (Conversion or Turning line) and Kijun-sen (Base or Standard line) are moving horizontally and close to each other.
On the following picture, you can see examples of ICH sideways market signals.
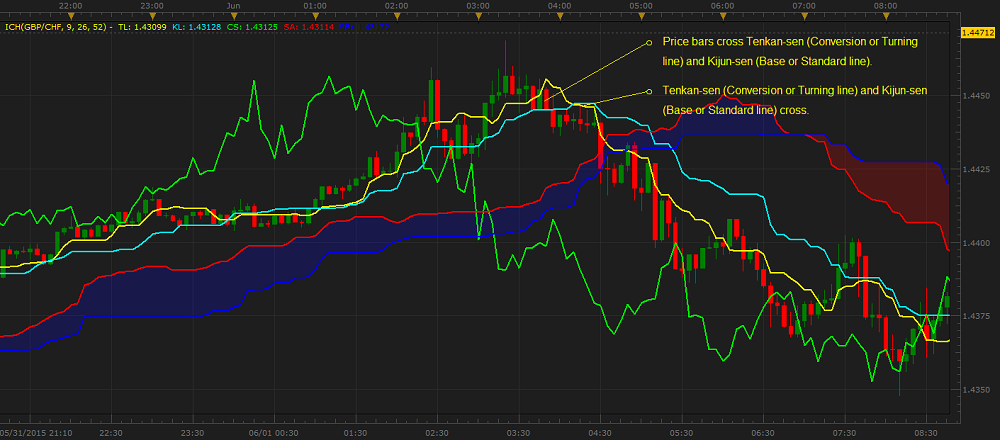
- Trend Reversal
Two major signals of a possible trend reversal are:
- Tenkan-sen (Conversion or Turning line) and Kijun-sen (Base or Standard line) cross.
- Price bars cross Tenkan-sen (Conversion or Turning line) and Kijun-sen (Base or Standard line).
On the following picture, you can see examples of ICH trend reversal signals.
Please note that not all the signals are supposed to be present on the chart at a given moment. The more of them are present, the stronger the trading signals are, and vice versa.
The ICH values are calculated using the following formulas:
TS = (HT + LT) / 2
where:
TS - the Tenkan-sen (Conversion or Turning line) value of the current period.
HT - the highest price value of the Tenkan-sen time frame (specified by the Tenkan-sen period parameter).
LT - the lowest price value of the Tenkan-sen time frame (specified by the Tenkan-sen period parameter).
KS = (HK + LK) / 2
where:
KS - the Kijun-sen (Base or Standard line) value of the current period.
HK - the highest price value of the Kijun-sen time frame (specified by the Kijun-sen period parameter).
LK - the lowest price value of the Kijun-sen time frame (specified by the Kijun-sen period parameter).
SA = (TS + KS) / 2
where:
SA - the Senkou Span A (Leading line A) value of the current period. It is plotted the same number of periods as the Kijun-sen time frame ahead of the current period.
SB = (HSB + LSB) / 2
where:
SB - the Senkou Span B (Leading line B) value of the current period. It is plotted the same number of periods as the Kijun-sen time frame ahead of the current period.
HSB - the highest price value of the Senkou Span B time frame (specified by the Senkou Span B period parameter).
LSB - the lowest price value of the Senkou Span B time frame (specified by the Senkou Span B period parameter).
CS = CP
where:
CS - the Chikou Span (Lagging line) value of the current period. It is plotted the same number of periods as the Kijun-sen time frame behind the current period.
CP - the closing price value of the current period.
back