RLW (%R Larry Williams)
RLW (%R Larry Williams) is a momentum indicator. Its basics were developed by Larry Williams and first introduced in his book How I Made One Million Dollars Last Year Trading Commodities in 1973.
RLW helps to monitor an instrument's price momentum or, in other words, the rate (speed) of price changes. It is believed that momentum always foreruns and influences price changes. The greater the momentum is, the faster an instrument's price changes, and the faster it changes, the stronger the price trend is. Thus, a trader can see a price trend's presence, evaluate its strength, and anticipate possible trend reversals.
For these purposes, the level of a period's close price relative to the high-low price range of a specified number of periods is calculated (the mathematical formula is provided later in the article). As a result, values in the range from 0 through -100 are obtained for each period. On a chart, RLW is drawn in the form of a line oscillating within this range (0 to -100). When the line goes up, an uptrend is present. Conversely, when the line goes down, a downtrend is present. The line moving horizontally for a noticeable period of time suggests a sideways market presence. The steeper the line is, the stronger the trend is. When prices are persistently higher than the Overbought Level or lower than Oversold Level, a trend reversal can be expected.
As all oscillators, RLW is always drawn in an additional area below the market price chart.
On the following picture, you can see an example of the RLW oscillator (with all its important level lines) drawn in an additional area below the market price chart.
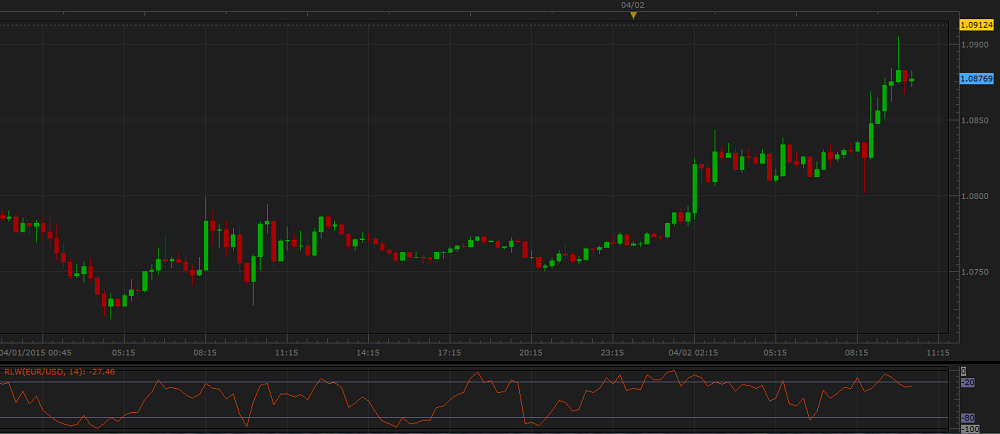
Please remember that RLW oscillator uses the historical data for its calculation, and all the information it provides belongs to the past. Indicators do not predict the market price future behavior. A trader can only suppose that the past tendencies will continue to develop in the same way for some time in the future and try to use this supposition appropriately.
As a momentum oscillator, RLW suits both ranging and trending markets, provided the trend takes on a zigzag format.
It is good to use the oscillator in conjunction with a market price chart and trend-following indicators that can confirm or deny its trading information. Adding one or two RLW charts with different
Number of periods parameter's values can also be a good idea to confirm the indicator's trading signals.
To apply an RLW oscillator to a chart, a trader needs to follow the procedure common to all Marketscope indicators. For more information,
see the Add Indicator article.
During the procedure, a trader can customize an indicator by specifying its parameters in the Properties dialog box. For more information, see the Change Indicator Properties article.
The parameters fall into three groups:
- Calculation - the parameters needed to calculate an indicator's prices.
- Style and Appearance - the parameters needed to specify the way an indicator appears on a chart.
- Levels - the parameters needed to specify the values of overbought and oversold level lines.
The RLW oscillator has only one Calculation parameter - Number of periods. The parameter allows to specify the number of periods, over which the oscillator is to be calculated. The possible
values are from 2 through 1,000. The default value is 14. The smaller the number is, the more sensitive the oscillator becomes. Its line has a greater amplitude and crosses the Overbought and
Oversold level lines more often and for a longer period of time. The greater the number is, the less sensitive the oscillator becomes. Its line has a smaller amplitude and crosses the Overbought
and Oversold level lines less often and for a shorter period of time. Traders choose the Number of periods parameter's value in accordance with their need of the level of sensitivity of the oscillator.
The recommended and most commonly used value is the default one - 14.
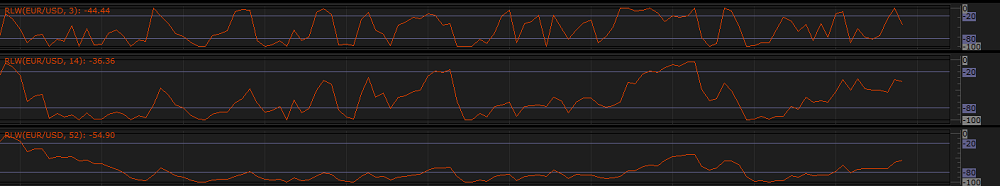
On the following picture, you can see examples of RLW oscillators with different Number of periods parameter's values (3, 14, and 52).
The parameter is available on the Parameters tab of the RLW Properties dialog box under the Calculation heading.
The RLW oscillator has several Levels' parameters:
- Overbought level - the parameter allows to specify the threshold, at which an instrument can be considered overbought. The possible values are from 0 through -100. The default value is
-20. Traders choose the parameter's values in accordance with their need of the level of the threshold. The recommended and most commonly used value is the default one - -20.
- Oversold level - the parameter allows to specify the threshold, at which an instrument can be considered oversold. The possible values are from 0 through --100. The default value is -80. Traders choose the parameter's values in accordance with their need of the level of the threshold. The recommended and most commonly used value is the default one - -80.
- Line levels width - the parameter allows to specify the widths of the Overbought and Oversold level lines, and it works as the Lines width parameter listed under the Style heading on the Parameters tab of an indicator's Properties dialog box.
- Line levels style - the parameter allows to specify the styles of the Overbought and Oversold level lines, and it works as the Lines style parameter listed under the Style heading on the Parameters tab of an indicator's Properties dialog box.
- Line levels color - the parameter allows to specify the colors of the Overbought and Oversold level lines, and it works as the Lines color parameter listed under the Style heading on the Parameters tab of an indicator's Properties dialog box.
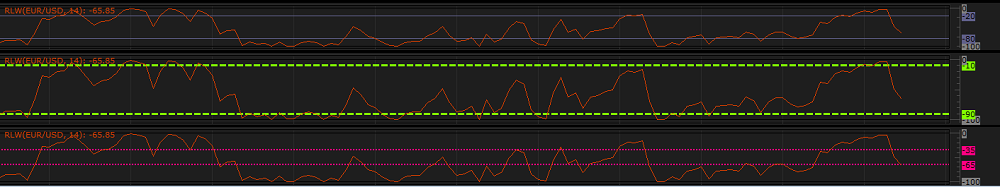
On the following picture, you can see how RLW oscillators of different Levels parameter's values (with level lines of different Overbought level and Oversold level values, widths, styles, and colors) look like on a chart.
The parameters are available on the Parameters tab of the RLW Properties dialog box under the Levels heading.
When an RLW oscillator is drawn on a chart, a trader can analyze its information and try to interpret it correctly. RLW produces several trading signals:
- Divergences
Divergences occur when the market prices and oscillator move in the opposite directions (divergence itself) or towards each other (often called convergence). It is a very strong signal of a possible trend reversal. Divergences are further subdivided into the following two types:
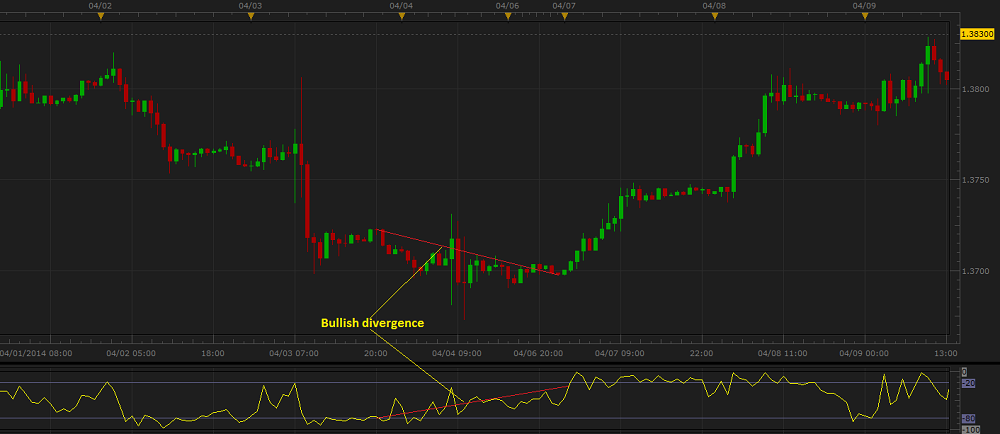
- Bullish divergence occurs when an instrument's prices move down, but the RLW oscillator moves up or flat. This shows less downside momentum that can be treated as a warning of a bullish
reversal and the need to consider closing of Sell positions and opening of Buy ones.
On the following picture, you can see an example of a bullish divergence.
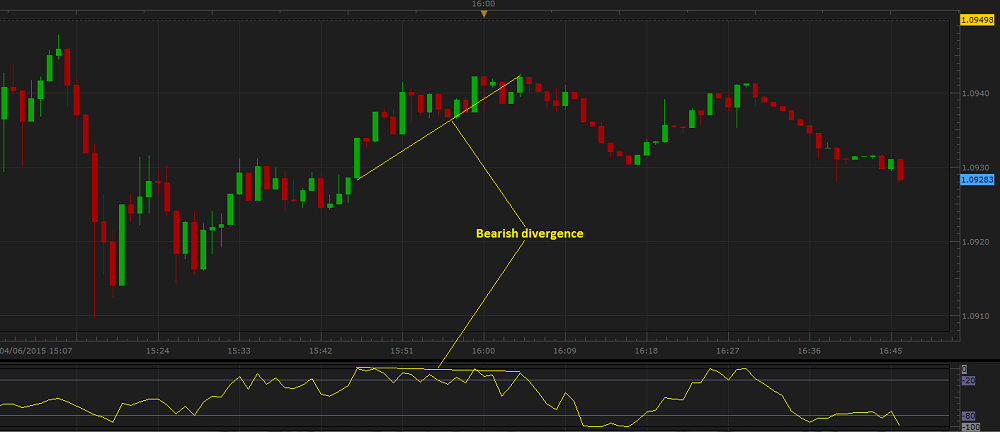
- Bearish divergence occurs when an instrument's prices move up, but the RLW oscillator moves down or flat. This shows less upside momentum that can be treated as a warning of a bearish
reversal and the need to consider closing of Buy positions and opening of Sell ones.
On the following picture, you can see an example of a bearish divergence.
Please note that divergences are often misleading in a strong price trend: a bullish (or bearish) divergence can occur in a strong downtrend (or uptrend) and yet the strong downtrend (or uptrend)
continues. Once a divergence takes hold, a trader should look for a confirmation of an actual reversal by other technical analysis tools.
- Overbought and Oversold Levels
Because the RLW oscillator is range bound, it can also be useful for identifying whether an instrument is overbought or oversold. An instrument is overbought when RLW on its way up crosses the
Overbought level (-20 by default) and approaches the zero line. It is oversold when the oscillator's line on its way down crosses the Oversold level (-80 by default) and
approaches the -100 line. The scenarios produce the following trading signals:
- The RLW oscillator's line rising above the Overbought level can be a warning of a possible trend reversal downwards and the need to consider closing of Buy positions and opening
of Sell ones.
- The RLW oscillator's line dropping below the Oversold level can be a warning of a possible trend reversal upwards and the need to consider closing of Sell positions and opening of Buy ones.
On the following picture, you can see examples of the Overbought and Oversold signals.

Note: An instrument can stay overbought or oversold for a long period of time. Therefore, if RLW crosses the Overbought or Oversold level line, do not undertake immediate actions until the oscillator's line crosses the level in the opposite direction.
The RLW oscillator's values are calculated automatically using the following formula:
RLWi = ((HighestN - Closei) / (HighestN - LowestN)) x -100
where:
RLWi - is the RLW value of the period being calculated.
HighestN - is the highest price of the N-period time frame.
N - is the number of periods, over which the RLW value is calculated.
Closei - is the closing price of the period being calculated.
LowestN - is the lowest price of the N-period time frame.
back