ROC (Rate of Change)
ROC (Rate of Change) is a momentum oscillator.
ROC helps monitoring an instrument's price momentum or, in other words, the speed of price changing. It is believed that momentum always foreruns and influences price changes. The greater the momentum is, the
faster an instrument's price changes, and the faster it changes, the stronger its trend is. Thus, a trader can see a price trend's presence and direction, evaluate its strength, and anticipate possible trend
reversals and make informed trading decisions.
ROC calculates its values as a percentage amount by which the current period's price differs from that of N periods ago (the mathematical formula is provided later in the article). The calculation is performed
automatically, and, as a result, certain values are obtained for each period.
On a chart, ROC is drawn in the form of a line moving up and down above and below the zero line. When the oscillator's line goes up, an uptrend prevails. Conversely, when the oscillator's line goes down, a
downtrend prevails. The farther away from the zero line the ROC line is, the stronger the price momentum is. Extreme values warn of oversold and overbought conditions of an instrument and possible trend reversals.
The line's moving close to the zero line for a noticeable period of time suggests a sideways market presence.
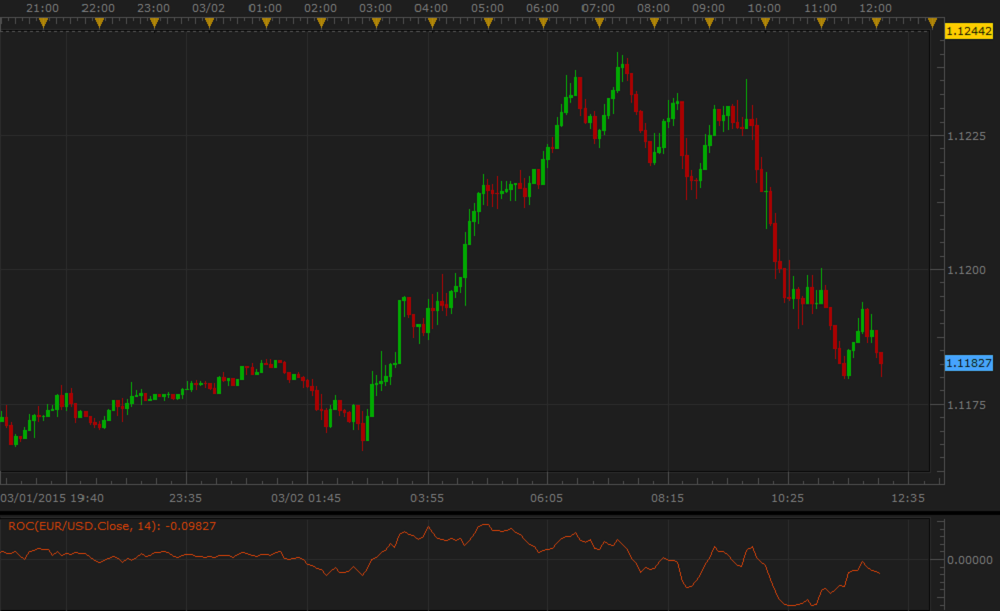
Note that the ROC oscillator is always drawn in an additional area below the market price chart.
On the following picture, you can see an example of ROC drawn in an additional area below the market price chart.
Please remember that the ROC oscillator uses the historical data for its calculation, and all the information it provides belongs to the past. Indicators do not predict the market price future behavior. A trader
can only suppose that the past tendencies will continue to develop in the same way for some time in the future and try to use this supposition appropriately.
As a momentum oscillator, ROC suits both ranging and trending markets, provided the trend takes on a zigzag format.
It is good to use the oscillator in conjunction with the market price chart and trend-following indicators that can confirm or deny its trading information.
To apply a ROC oscillator to a chart, a trader needs to follow the procedure common to all Marketscope indicators. For more information,
see the Add Indicator article.
During the procedure, a trader can customize an indicator by specifying its parameters in the Properties dialog box. For more information, see the Change Indicator Properties
article.
The parameters fall into two groups:
- Calculation - the parameters needed to calculate an indicator's prices.
- Style and Appearance - the parameters needed to specify the way an indicator appears on a chart.
The ROC oscillator has only one Calculation parameter - Number of periods. The parameter allows to specify the number of periods, over which the ROC oscillator's values are to be calculated.
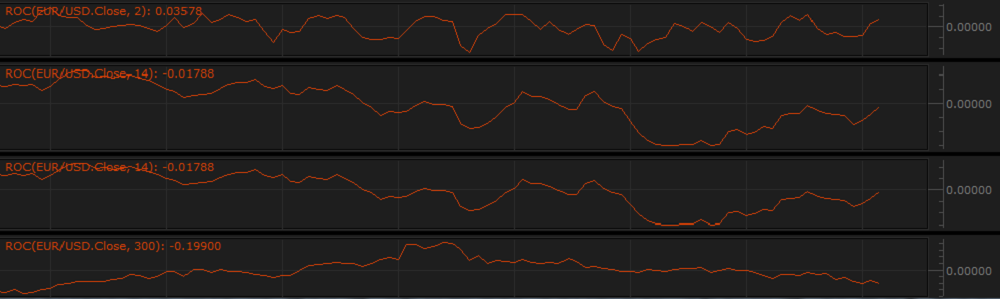
The possible values are from 2 through 1,000. The default value is 14. The smaller the number is, the more sensitive the oscillator becomes. Its line looks choppy and changes its direction more often.
The greater the number is, the less sensitive the oscillator becomes. Its line is smoother and has a smaller amplitude. Traders choose the Number of periods parameter's value in accordance with their
need of the level of sensitivity of the oscillator. The most commonly used value is the default one - 14.
On the following picture, you can see how ROC oscillators of different Number of periods values look like on a chart.
The parameter is available on the Parameters tab of the ROC Properties dialog box under the Calculation heading.
When a ROC oscillator is drawn on a chart, a trader can analyze and interpret its information. ROC produces the following trading signals:
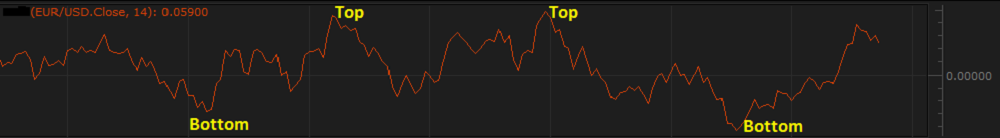
- Tops and Bottoms
- The oscillator's line rising to extreme values near the upper boarder of the chart (Top) is a warning of an instrument's being overbought and a possible trend reversal downwards. It is advised to consider closing of Buy and opening of Sell positions.
- The oscillator's line dropping to extreme values near the lower boarder of the chart (Bottom) is a warning of an instrument's being oversold and a possible trend reversal upwards. It is advised
to consider closing of Sell and opening of Buy positions.
On the following picture, you can see examples of the Tops and Bottoms signals.
Note: Instruments can stay overbought or oversold for long periods of time. Therefore, if ROC reaches Tops or Bottoms, do not undertake immediate actions and wait till the line
starts moving in the opposite direction.
- Divergence
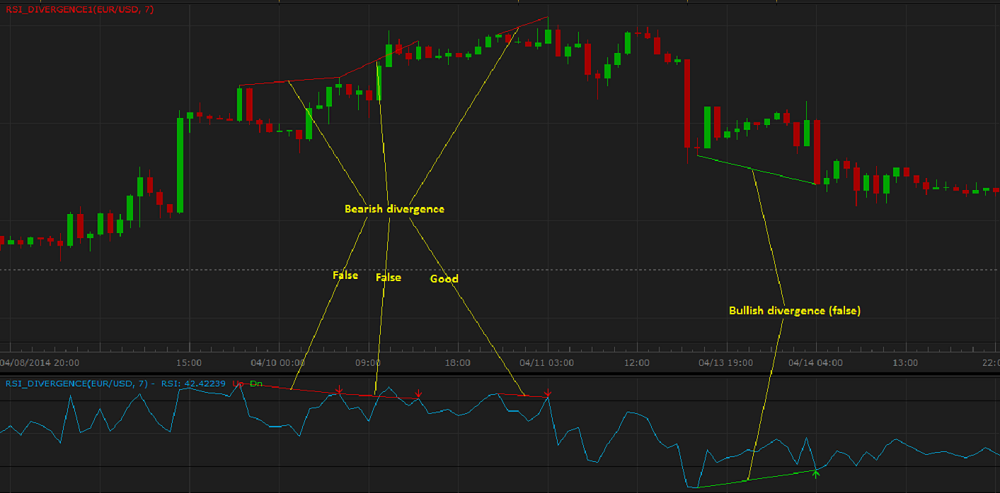
Divergence between the market price movement and the oscillator's line directions is a very strong signal of a trend reversal. There are two types of divergences:
- Bullish divergence occurs when the ROC oscillator after having reached a Bottom starts moving up and the market price movement continues to remain flat or decreasing.
- Bearish divergence occurs when the ROC oscillator after having reached a Top starts moving down and the market price movement continues to remain flat or increasing.
On the following picture, you can see examples of the Divergence signals.
When a ROC oscillator is drawn on a chart, a trader can analyze its information and try to interpret it correctly. The Buy and Sell signals are provided by the direction of the oscillator's line.
When the line is going upwards, consider opening of Buy positions. On the contrary, when the line is going downwards, consider opening of Sell positions. The line's extreme values near the upper
and lower boarders of the chart signal possible trend reversals and the need to consider appropriate actions regarding opening and closing of trading positions. It is advisable to confirm or deny the ROC
information with other indicators' trading signals.
Please note that divergences are often misleading in a strong price trend: bullish (or bearish) divergences can occur in a strong downtrend (or uptrend) and yet the strong downtrend (or uptrend) continues.
It is advised to confirm or deny the ROC information with other indicators' trading signals.
On the following picture, you can see examples of the ROC trading signals.

The ROC oscillator's values are calculated automatically using the following formula:
ROCi = 100 x ((Pricei / PriceN) - 1)
where:
ROCi - is the ROC value of the period being calculated.
Pricei - is the Data Source price of the period being calculated.
PriceN - is the Data Source price of N periods ago (N is set by the Number of periods parameter's value).
back