REGRESSION (Regression Line)
REGRESSION (Regression Line) is a trend-following indicator.
The Regression Line indicator helps to determine an instrument's price trend presence and direction. For the purpose, Linear Regression values are calculated by using the method of minimum distance between the price data points and the Linear Regression line, and the last of these values is used as the value of the period's REGRESSION value. Thus, any point along the Regression Line indicator is equal to the ending value of the Linear Regression line calculated over a specified number of periods. As a result, a line moving up and down is drawn on a chart. It "forecasts" where prices "should" be trading on a statistical basis. When the line goes up, an uptrend is present. Conversely, when the line goes down, a downtrend is present. The line moving horizontally for a noticeable period of time suggests a sideways market presence. When prices are persistently higher or lower than the "forecasted" price values, expect them to quickly return to more realistic values.
Note that the indicator can be drawn on the market price chart as well as in an additional area below it.
On the following picture, you can see an example of the REGRESSION indicator drawn on the market price chart and in an additional area below it.
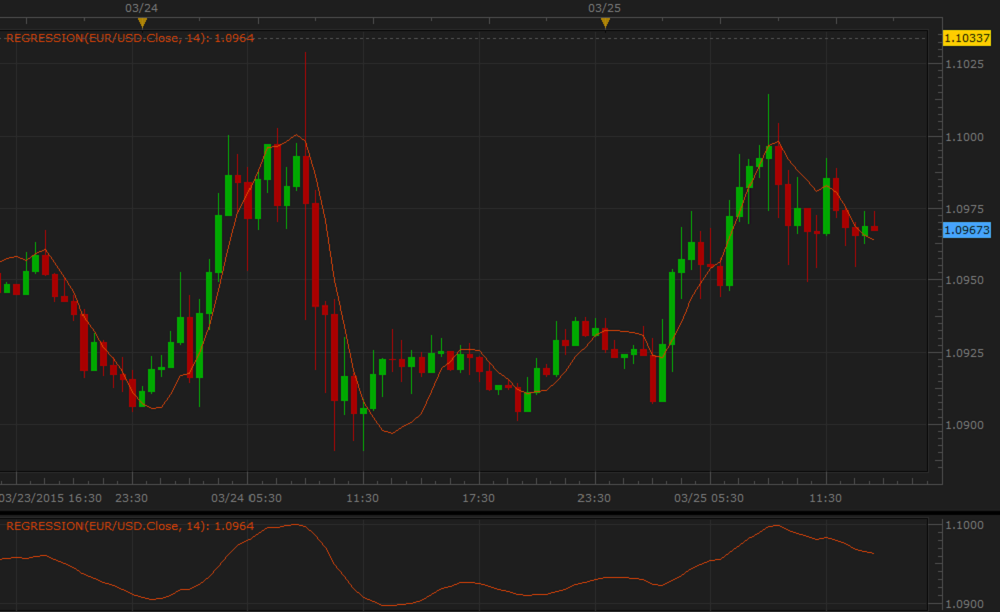
REGRESSION builds its line by using real prices without averaging them. Thus, it is more responsive to the market changes and does not exhibit as much lagging behind the prices as moving average indicators do.
REGRESSION works best on stable descending or ascending market price trends.
It is good to use the indicator in conjunction with a market price chart and trend-following indicators that can confirm or deny its trading information. Adding one or two REGRESSION charts with different Number of period parameter's values can also be a good idea to confirm the indicator's trading signals.
Please remember that REGRESSION uses the historical data for its calculation, and all the information it provides belongs to the past. A trader can only suppose that the market situation will continue to develop in the same way for some time in the future and try to use this supposition appropriately.
To apply a REGRESSION indicator to a chart, a trader needs to follow the procedure common to all Marketscope indicators. For more information, see the Add Indicator article.
During the procedure, a trader can customize an indicator by specifying its parameters in the Properties dialog box. For more information, see the Change Indicator Properties article.
The parameters fall into two groups:
- Calculation - the parameters needed to calculate an indicator's prices.
- Style and Appearance - the parameters needed to specify the way an indicator appears on a chart.
REGRESSION has only one Calculation parameter - Number of periods. The parameter allows to specify the number of periods, over which the indicator is to be calculated. The possible values are
from 1 through 1,000. The default value is 14. The smaller the number is, the less market noises the indicator filters, and the faster it reacts to the market price changes. Its line stays closer to the
price bars, thus, following the shorter-term market trends. The greater the number is, the more market noises the indicator filters, and the slower it reacts to the price changes. Its line stays more away from
the market price bars, thus, following the longer-term market trends. Traders choose the Number of periods parameter's value in accordance with their trading tasks, strategies, and techniques. The
commonly used values are 7, 14, 26, and 52.
The parameter is available on the Parameters tab of the REGRESSION Properties dialog box under the Calculation heading.
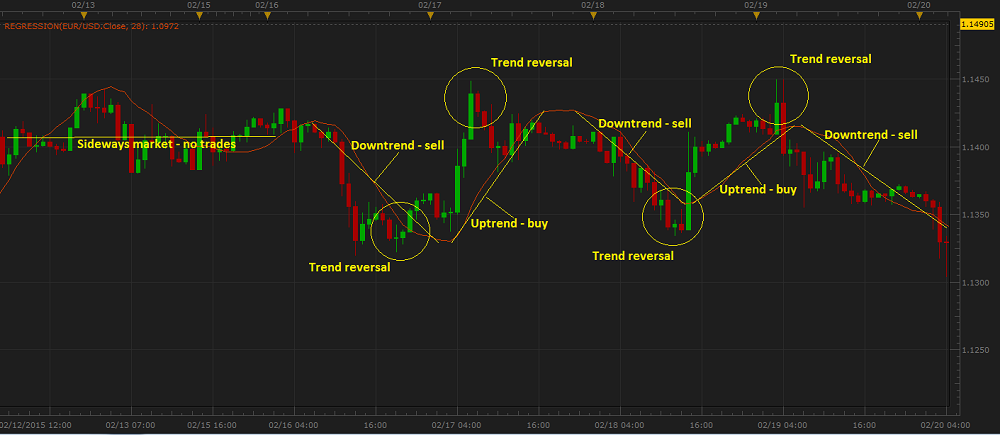
When a REGRESSION indicator is drawn on a chart, a trader can analyze its information and make use of the following trading signals:
- Trend Indication
- Uptrend is present when the indicator's line goes steadily upwards. It is advised to consider closing of Sell and opening of Buy positions.
- Downtrend is present when the indicator's line goes steadily downwards. It is advised to consider closing of Buy and opening of Sell positions.
Note that the line indicates a Sideways market when it stays horizontal for a noticeable period of time. It is advised to refrain from trading activities.
- Trend Reversals Indication
When the indicator's line deviates from the price bars excessively, it is a warning of a possible trend reversal.
On the following picture, you can see examples of the REGRESSION trading signals.
The REGRESSION values are the last values of the Linear Regression calculated automatically for every given period by using a complex calculation called the least squares method. To put it in simple words, a
Linear Regression line is a straight line that is as close to all of the given values as possible.
back