TSI (True Strength Index)
TSI (True Strength Index) is a very popular and widely used momentum oscillator. It was developed by William Blau and presented in the Technical Analysis of STOCKS & COMMODITIES magazine in November, 1991.
TSI helps to monitor an instrument's price momentum or, in other words, the rate (speed) of price change. It is believed that momentum always foreruns and influences price changes. The greater the momentum
is, the faster an instrument's price changes, and the faster it changes, the stronger the price trend is.
TSI calculates its values as a percentage amount by which the current period's double-smoothed price differs from that of the immediately preceding double-smoothed one (the mathematical formula is provided
later in the article). The calculation is performed automatically, and, as a result, certain values are obtained for each period. On a chart, TSI is drawn in the form of a line moving up and down above and
below the zero line. When the oscillator's line goes up, an uptrend prevails. Conversely, when the oscillator's line goes down, a downtrend prevails. The farther away from the zero line the TSI line is, the
stronger the price momentum is. Extreme values warm of oversold and overbought conditions of an instrument and possible trend reversals. The line's moving close to the zero line for a noticeable period of
time suggests a sideways market presence.
Note that the TSI oscillator is always drawn in an additional area below the market price chart.
On the following picture, you can see an example of TSI drawn in an additional area below the chart.
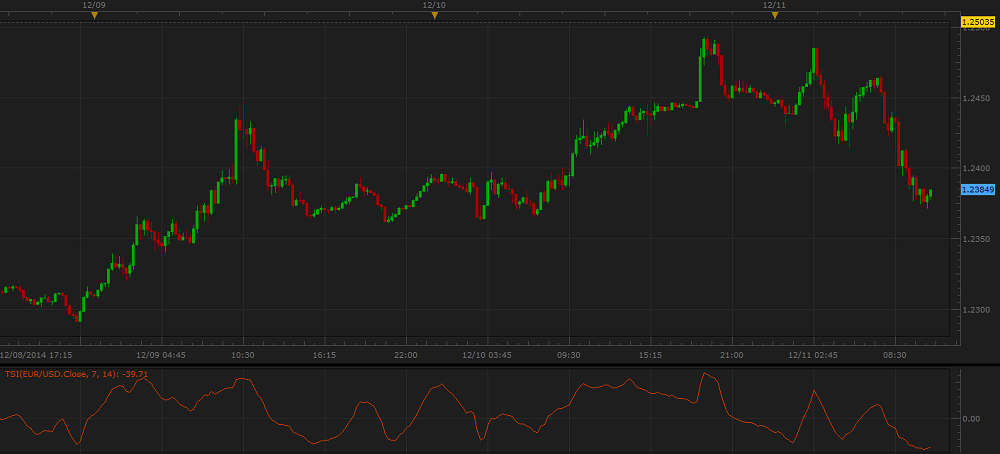
The double-smoothing technique in its calculation allows TSI to eliminate lagging behind the market price movement, which is characteristic of many other indicators.
It is good to use the oscillator in conjunction with the market price chart and other trend-following indicators that can confirm or deny its trading information.
Please remember that the TSI oscillator uses the historical data for its calculation and all the information it provides belongs to the past. A trader can only suppose that the past tendencies of the market
behavior will continue to develop in the same way for some time in the future and try to use them appropriately.
To apply a TSI oscillator to a chart, a trader needs to follow the procedure common to all Marketscope indicators. For more information, see the Add Indicator article.
During the procedure, a trader can customize the oscillator by specifying its parameters in the Properties dialog box. For more information, see the Change Indicator Properties article.
The parameters fall into two groups:
- Calculation - the parameters needed to calculate an indicator's prices.
- Style and Appearance - the parameters needed to specify the way an indicator appears on a chart.
The TSI oscillator has two Calculation parameters:
- Smooth 1 - the parameter allows to specify the number of periods, over which the value of the first smoothing (the current period's price momentum) is to be calculated. The possible values are
from 2 through 1,000. The default value is 7. The smaller the number is, the more sensitive the oscillator becomes. Conversely, the greater the number is, the less sensitive the oscillator
is. Traders choose the Smooth 1 parameter's value in accordance with their need of the level of sensitivity of the oscillator. The recommended and most commonly used is the default value - 7.
- Smooth 2 - the parameter allows to specify the number of periods, over which the value of the second smoothing (the result of the first smoothing) is to be calculated. The possible values are
from 2 through 1,000. The default value is 14. The smaller the number is, the more sensitive the oscillator becomes. Conversely, the greater the number is, the less sensitive the oscillator
is. Traders choose the Smooth 2 parameter's value in accordance with their need of the level of sensitivity of the oscillator. The recommended and most commonly used is the default value - 14.
On the following picture, you can see how oscillators of different Smooth 1 and Smooth 2 values with lines of different colors, styles, and widths look like on a chart.
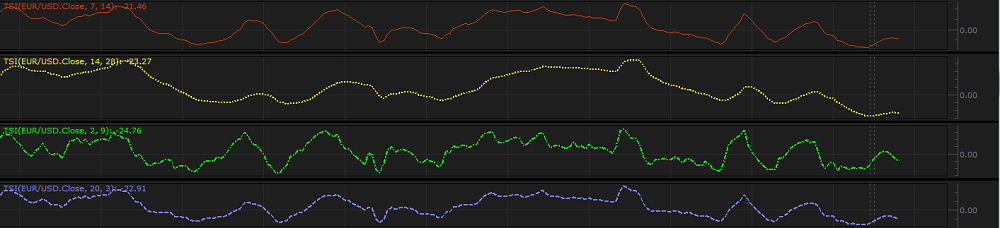
Note that the zero line is always of gray color and cannot be modified.
The parameters are available on the Parameters tab of the TSI Properties dialog box under the Calculation heading.
When an TSI oscillator is drawn on a chart, a trader can analyze its information and try to interpret it correctly. TSI produces the following trading signals:
- Zero line crossing
- The TSI line's crossing the zero line from below can be a warning of an uptrend beginning and the need to consider opening of Buy positions.
- The TSI line's crossing the zero line from above can be a warning of a downtrend beginning and the need to consider opening of Sell positions.
On the following picture, you can see examples of the Zero line crossing signals.

Note that TSI produces multiple Zero line crossing signals, and many of them are premature. One of the solutions of the problem is using of other technical analysis tools in conjunction
with the oscillator such as trend following indicators that either confirm or deny a change in direction of the trend.
- Overbought and Oversold conditions
Though the TSI oscillator is not range bound, it is also useful for identifying whether an instrument is oversold or overbought. An instrument is oversold when the TSI line forms a deep bottom below
the zero line, and it is overbought when the oscillator's line peaks above the zero line. The scenarios produce the following trading signals:
- The TSI oscillator's line moves far below the zero line forming a deep bottom can be a warning of a possible trend reversal upwards and the need to consider closing of Sell positions and
opening of Buy ones.
- The TSI oscillator's line moves far above the zero line forming a peak can be a warning of a possible trend reversal downwards and the need to consider closing of Buy positions and
opening of Sell ones.
On the following picture, you can see examples of the Overbought and Oversold signals.

Note: An instrument can stay overbought or oversold for a long period of time. Therefore, if TSI forms a deep bottom (oversold) or high peak (overbought), do not take immediate trading decisions
until the bottom or peak is well shaped or confirmed by signals of other technical analysis tolls.
- Divergence
Divergence between the market price movement and the oscillator directions is a very strong signal of a trend reversal. There are two types of divergences:
- Bullish divergence - occurs when the market prices move up and the TSI oscillator's line decreases or remains flat.
- Bearish divergence - occurs when the market prices move down and the TSI oscillator's line increases or remains flat.
On the following picture, you can see examples of the Divergence signals.
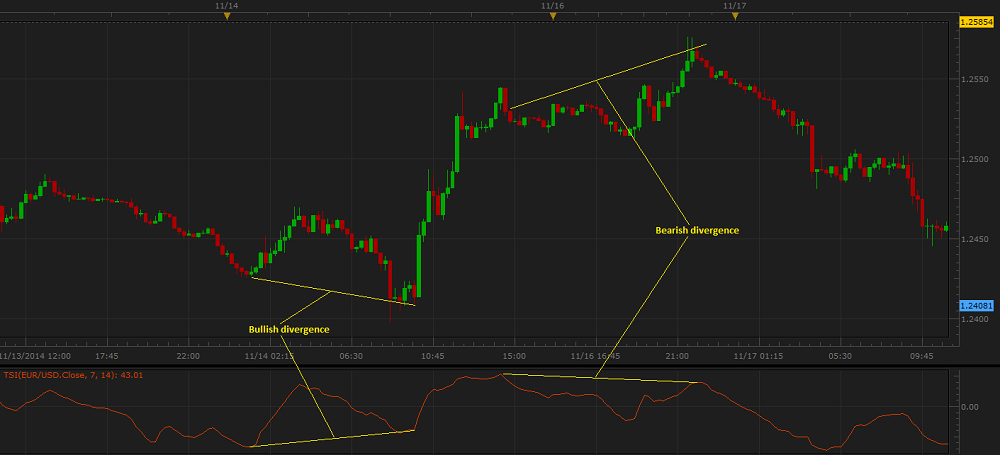
Please note that divergences are often misleading in a strong price trend: bullish (or bearish) divergences can occur in a strong downtrend (or uptrend) and yet the strong downtrend (or uptrend)
continues.
The TSI oscillator's values are calculated automatically using the following formulas:
TSI = 100 x EMAS2(EMAS1(PM)) / EMAS2(EMAS1(|PM|))
PM = Pricei - Pricei-1
|PM| = Absolute value of Pricei - Pricei-1
where:
TSI - is the True Strength Index value of the period being calculated.
PM - is the current period's real price momentum.
|PM| - is the current period's absolute value price momentum.
EMAS1 - is the EMA (the number of periods is specified by the Smooth 1 Calculation parameter) indicator's value of the current period's PM or |PM|.
EMAS2 - is the EMA (the number of periods is specified by the Smooth 2 Calculation parameter) indicator's value of the current period's EMAS1(PM) or
EMAS1(|PM|).
Pricei - is the Data Source (Close, by default) price of the period being calculated.
Pricei-1 - is the Data Source (Close, by default)price of the period immediately preceding the one being calculated.
back