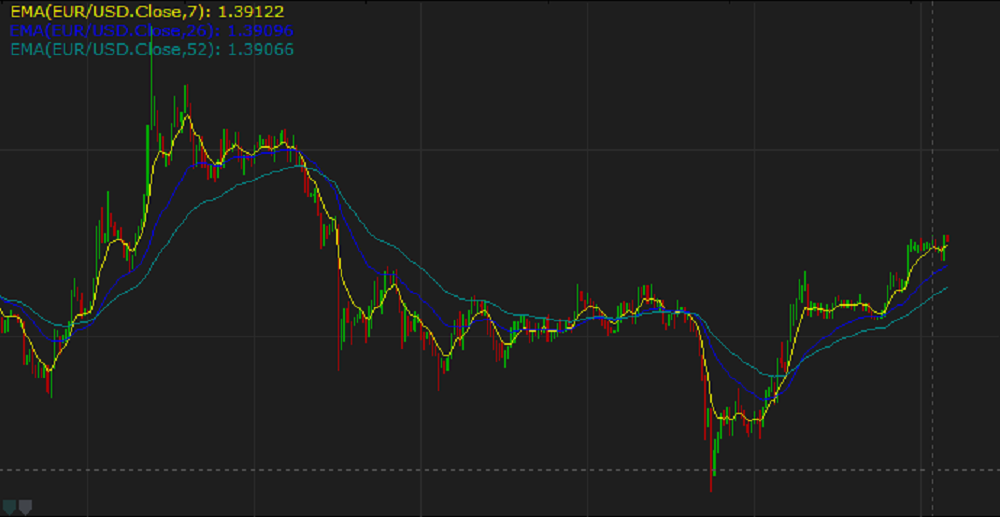
EMA smooths the market noises and shows the market trends more clearly.
To achieve the goals, the indicator filters out the market fluctuations (noises) by averaging the price values of the periods, over which it is calculated. In the process, EMA adds some extra value (weight) to the price of the period being calculated, therefore, allowing the most recent prices to play a more important role in the indicator's calculation. At the same time, the importance of all the other preceding period's price diminishes exponentially. As a result, the EMA indicator responds to the market price changes faster making its lagging less significant than that of the MVA indicator. Moreover, as the importance of all the other preceding periods' prices diminishes, their second impact on the calculation of a new period's price is less significant than it is in the case of the MVA indicator which all and every period's prices have equal impact on its calculation.
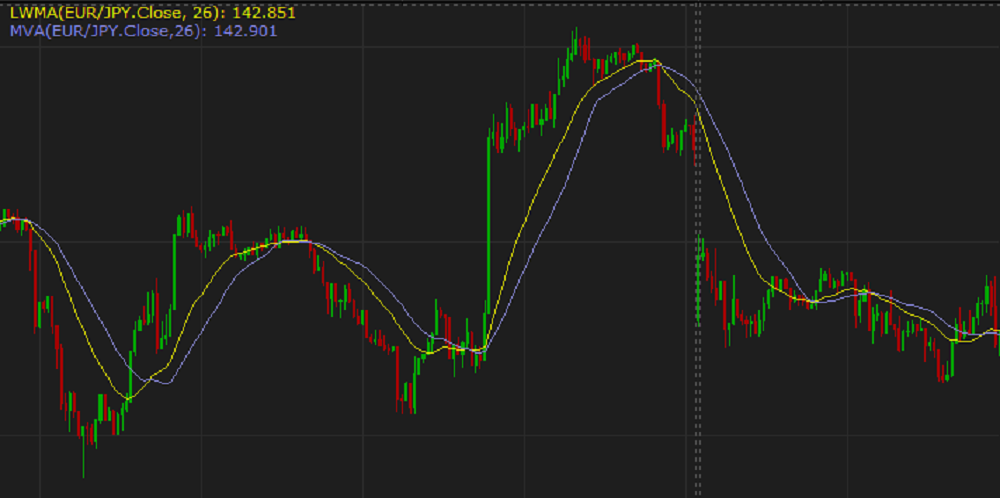
On the following picture, the blue line of the EMA indicator of 26 periods reacts to the market prices' changes faster and stays closer to the price bars than the yellow line of the MVA indicator of the same number of periods.
By employing the EMA indicator, a trader gets a crisp picture of the market behavior and can make informed trading decisions. It is also good to use an EMA indicator in combination with another EMA indicator of a different period length or other than EMA trend-following indicators.
Please note that as all the other technical analysis indicators, EMA works well only when certain factors influence the market. It is good on stable descending or ascending trends. Whereas in case of sideway market price movements, the EMA indicator is useless, and a trader should refrain from any trading activity or, if the trading skills and experience permit, use special techniques such as pip-hunting.
Besides, the EMA indicator uses the historical data for its calculation, and as a result, it reveals the market trend that has already developed and does not show the future trend. A trader can only suppose that the past trend will continue to develop in the same direction for some time in the future and make appropriate trading decisions.
The EMA indicator is used as a calculation component of other technical analysis indicators such as the ADX (Average Directional Index), MACD (Moving Average Convergence/Divergence), and some other indicators.
To apply an EMA indicator to a chart, a trader needs to follow the procedure common to all Marketscope indicators. For more information, see the Add Indicator article.
During the procedure, a trader can customize an indicator by specifying its parameters in the Properties dialog box. For more information, see the Change Indicator Properties article.
The parameters fall into two groups: