MACD (Moving Average Convergence/Divergence)
MACD (Moving Average Convergence/Divergence) is one of the most popular and widely used technical analysis indicators. It was developed by Gerald Appel in the late seventies and finally shaped by Thomas Aspray
in 1986 when a histogram was added to the indicator's graphical presentation.
As all the other moving average indicators, in its calculation, MACD employs the technique of averaging the price values of the
periods, over which it is calculated. As a result, MACD produces two lines (in Marketscope called MACD and SIGNAL) and a histogram (in Marketscope called HISTOGRAM). The lines'
values are calculated as the difference between a shorter EMA (in Marketscope called Short EMA) and longer EMA (in Marketscope called Long EMA)
in the case of MACD; and an MVA value of the MACD values in the case of SIGNAL. The values of the MACD histogram are calculated as the difference between the values of
MACD and SIGNAL. The SIGNAL line lags behind the MACD line and helps detecting the directional turns of the latter. The MACD lines fluctuate, converge, diverge, and cross over each
other above and below the zero line of the MACD histogram producing an oscillator that reflects the momentum of the market price trends. At the same time MACD serves as a trend-following indicator. Please
note that MACD is always drawn in an additional area below the market price chart.
On the following picture you can see an example of the MACD oscillator in the additional area below the market price chart.
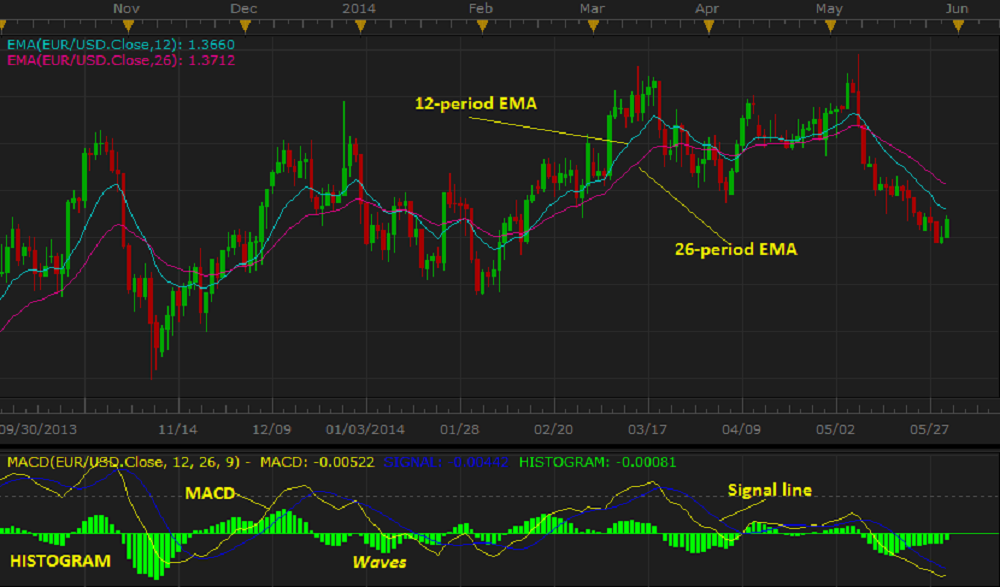
Originally, MACD was developed for the Stock market, and it performs best on one-day period charts, but a trader can use any other chart period.
MACD brings together momentum and trend in one indicator, thus, producing many trading signals (see later in the article). But on the other hand, the indicator often changes the direction of its lines. On a
chart, it resembles frequent waves. The waves are produced when the market is volatile and is moving sideways. These waves cause signals that can be false. Besides, the indicator's signals often lag behind
the market prices significantly. Therefore, a trader needs to use caution while interpreting the signals and making trading decisions. In a volatile market, it is better to refrain from active trading and
wait till the market behavior changes or use other technical analysis resources. The indicator is good on steady trends.
As an oscillator, MACD is not particularly good for identifying overbought and oversold levels. Even though it is possible to identify the levels that are historically overbought or oversold, the indicator
has no any upper or lower limits to bind its movement. During sharp price moves, MACD can exceed its historical extremes.
Besides, the MACD indicator uses the historical data for its calculation, and, as a result, it reveals the market momentum and trend that have already developed and does not show the future ones. A trader can
only suppose that the past events will continue to develop in the same direction for some time in the future and make appropriate trading decisions.
To apply a MACD indicator to a chart, a trader needs to follow the procedure common to all Marketscope indicators. For more information, see the Add Indicator article.
During the procedure, a trader can customize an indicator by specifying its parameters in the Properties dialog box. For more information, see the Change Indicator Properties
article.
The parameters fall into two groups:
- Calculation - the parameters needed to calculate an indicator's prices.
- Style and Appearance - the parameters needed to specify the way an indicator appears on a chart.
The MACD indicator has three Calculation parameters:
- Short EMA - the parameter allows to specify the number of periods, over which the Short EMA (used in the calculation of the MACD line) is to be calculated. The possible parameter's
values are from 2 through 1,000. The default value is 12. The smaller the number is, the more sensitive to the market changes the MACD line is and vice versa. The most popular is the
default value - 12.
- Long EMA - the parameter allows to specify the number of periods, over which the Long EMA (used in the calculation of the MACD line) is to be calculated. The possible parameter's
values are from 2 through 1,000. The default value is 26. The smaller the number is, the more sensitive to the market changes the MACD line is and vice versa. The most popular is the
default value - 26.
- Signal line - the parameter allows to specify the number of periods, over which the Signal line is to be calculated. The possible parameter's values are from 2 through 1,000. The default
value is 9. The smaller the number is, the closer to the MACD line the SIGNAL line is (theoretically, if the parameter is 1, which is not possible in Marketscope, the
two lines coincide completely) and vice versa. The most popular is the default values - 9.
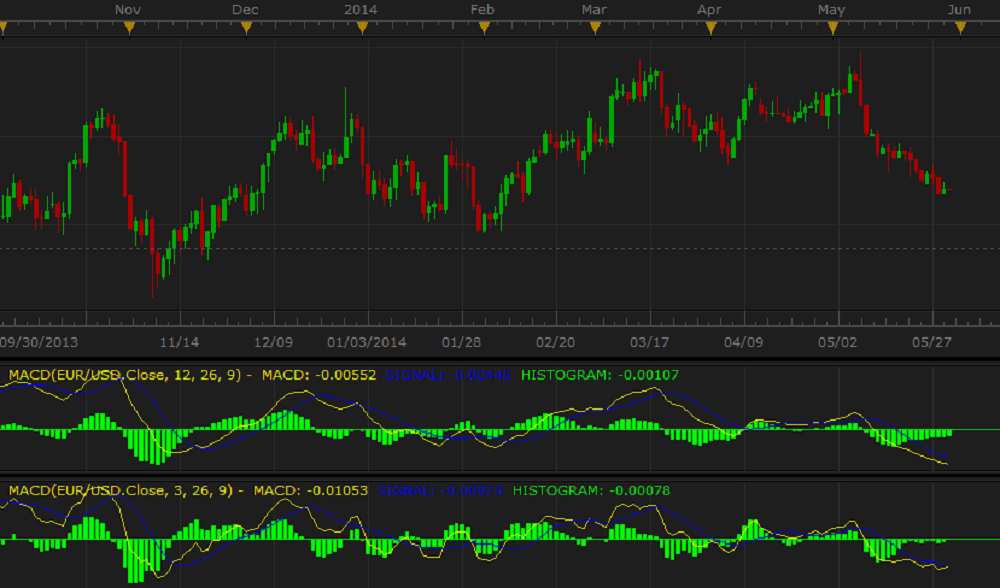
On the following picture, you can see that the yellow line of MACD (12, 26, 9) and histogram in the area immediately below the chart are smoother and react to the price changes slower than those of
MACD (5,26,9) in the bottom additional area.
The parameters are available on the Parameters tab of the MACD Properties dialog box under the Calculation heading.
When a MACD indicator is drawn on a chart, a trader can analyze its behavior and try to predict the beginning of a new market trend or ending of an old one, in other words, determine trend reversal points
that can serve as trading signals. The three main ways of the MACD indicator's interpretation are:
- Line crossovers - the MACD line shows the momentum of the market price changes. The faster the prices move in one direction, the higher the MACD line above the zero line is, and the
slower the prices move in one direction, the closer it to the zero line is. The moment the MACD line crosses over the zero line signals a possibility of a trend reversal. Crossing over the zero
line by the MACD line from above signals a trend reversal and the need to consider closing of Buy and opening of Sell positions. Crossing over the zero line by the MACD line
from below signals a trend reversal and the need to consider closing of Sell and opening of Buy positions.
Crossing over the SIGNAL line by the MACD line from above can be a warning of a trend reversal and the need to consider closing of Buy and opening of Sell positions.
Crossing over the SIGNAL line by the MACD line from below can be a warning of a trend reversal and the need to consider closing of Sell and opening of Buy positions.
- The histogram appearance - reflects the size of the difference between MACD and SIGNAL, thus, indicating the strength of the market trend momentum. The greater the difference is, the
taller the histogram bars are, and, therefore, the greater the market trend momentum is. The histogram is positive when the MACD line is above the SIGNAL line and negative when the
MACD line is below the SIGNAL line. Peaks, both positive and negative (easily determined visually), signify the possibility of trend reversals and the need to consider closing of
Buy or opening of Sell (positive peaks) positions or closing of Sell and opening of Buy (negative peaks) positions.
Crossing of the zero line by HISTOGRAM signals a trend reversal and the need to consider closing of Sell and opening of Buy (crossing from below) positions or closing of
Buy and opening of Sell (crossing from above) positions.
- Convergence/divergence - the movement of the market prices and the MACD line in the opposite directions:
- Convergence occurs when they move towards each other.
- Divergence occurs when they move away from each other.
Convergences and divergences are not very frequent and can be determined visually or with the help of special indicators such as MACD Divergence and MACD Divergence Trend. The indicators are not in
the list of standard indicators of Marketscope and can be imported from the following site: http://fxcodebase.com/code/viewtopic.php?f=17&t=869&p=1572
Convergence warns of a possible reversal of the price downtrend and the need to consider closing of Sell and opening of Buy positions.
Divergence warns of a possible reversal of the price uptrend and the need to consider closing of Buy and opening of Sell positions. Please remember that making trading decisions require caution and employment of additional market analysis tools as the signals can be false due to frequent waves produced by the indicator and its substantial lagging behind the market prices. The longer the convergence or divergence situations last, the more reliable the signals are.
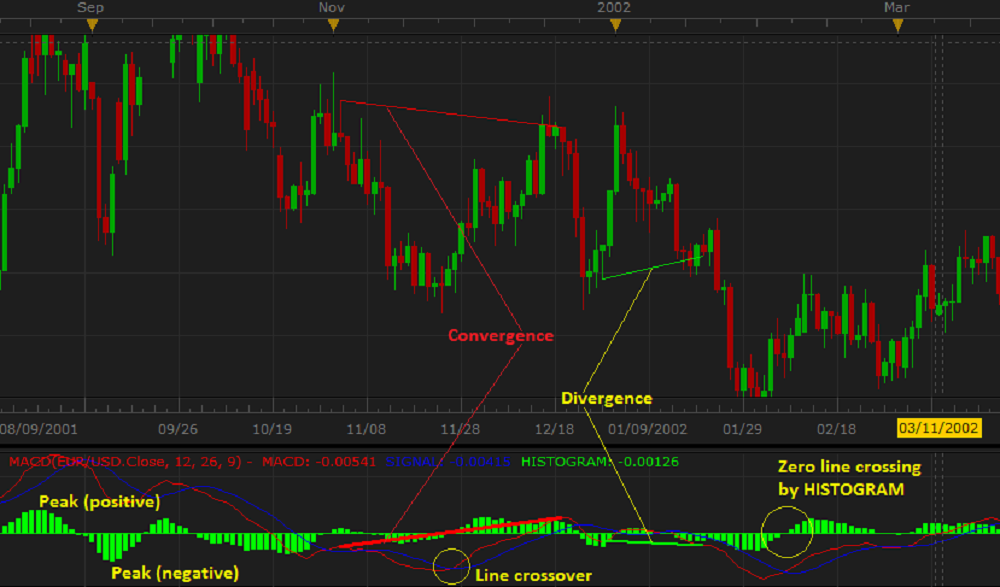
On the following picture you can see instances of the notions mentioned above. All the signals are good except for the Convergence signal (red) that is false as no trend reversal occurs.
The MACD indicator is calculated as follows:
MACD = Short EMA - Long EMA
SIGNAL = MVA of MACD
HISTOGRAM = MACD - SIGNAL
Note: For the EMA and MVA calculation formulas, see the EMA and MVA articles.
back