GATOR determines a market price trend's presence without indicating its direction up or down (uptrend or downtrend), thus, it is recommended using the oscillator in conjunction with other indicators, such as trend ones.
GATOR (Gator Oscillator)
GATOR (Gator Oscillator) is one of five Bill Williams' indicators included in the list of standard indicators of Marketscope (the other four are ALLIGATOR (Alligator), FRACTAL (Fractal), AC (Acceleration/Deceleration), and AO (Awesome Oscillator)). It was developed in 1995 and presented in Bill Williams' book New Trading Dimensions.
The name Gator is a metaphor used by the author because he saw a lot of similarity in the oscillator's behavior on the chart and a gator (alligator) in the wilds. To Bill Williams, the shapes of the oscillator's graphical presentations resemble the creature's big mouth with jaws, teeth, and lips, and how it sleeps, wakes up, opens the mouth, eats, closes the mouth, and falls asleep again. In the article, we will keep the author's metaphoric terminology.
In his book, Bill Williams states: "Most of the time, the market goes nowhere. Only 15 to 30 percent of the time does the market trend, and traders who are not on the floor make nearly all of their profits in a trending market." GATOR is intended to help detecting the market price trend's presence or absence, and, if the trend is present, its beginning and ending.
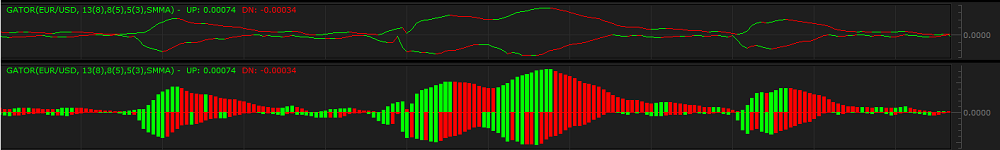
For these purposes, first, the ALLIGATOR indicator's values of the Jaw, Teeth, and Lip lines are calculated, then, the values are used to draw the GATOR oscillator. The Teeth line forms the centerline of the oscillator. The values above the centerline are calculated as the difference between the values of the Jaw and Teeth lines, and the values below the centerline are calculated as the negative difference between the absolute values of the Lip and Teeth lines. A trader can choose to present the GATOR values above and below the centerline as bars or lines. Their colors can also be specified, but the default colors are green and red. When a bar or line value is greater than the previous one, it is green. Conversely, when a bar or line value is less than the previous one, it is red. The bars or lines diverge from or converge towards the centerline, thus, indicating different states of the market. When the oscillator's lines or bars stay close to the centerline changing their colors between red and green, the market is assumed to be moving sideways (or, using Bill Williams' metaphor, the gator sleeps). When the lines or bars start to spread and diverge from the centerline, a market price trend begins (the gator opens the mouth and starts eating). When the lines or bars turn all green, the trend is formed, (the gator eats). The father the lines or bars diverge from the centerline, the stronger the trend is. When the lines or bars turn all red, the trend ends (the gator is sated and falls asleep waiting for the next market price trend to emerge).
Note that the oscillator is always drawn in an additional area below the market price chart.
On the following picture, you can see examples of the GATOR oscillator drawn with the help of lines and bars.
GATOR determines a market price trend's presence without indicating its direction up or down (uptrend or downtrend), thus, it is recommended using the oscillator in conjunction with other indicators, such as
trend ones.
Please remember that as its Data Source the oscillator uses the data of another indicator that, in its turn, uses the historical data and reveals the trends that belong to the past. A trader can only suppose that the market will continue to develop in the same way for some time in the future and try to use the supposition appropriately.
To apply a GATOR oscillator to a chart, a trader needs to follow the procedure common to all Marketscope indicators. For more information, see the Add Indicator article.
During the procedure, a trader can customize the oscillator by specifying its parameters in the Properties dialog box. For more information, see the Change Indicator Properties
article.
The parameters fall into two groups:
GATOR has the following Calculation parameters:
The parameters are available on the Parameters tab of the GATOR Properties dialog box under the Calculation heading.
GATOR has the following Style parameters:
The parameters are available on the Parameters tab of the GATOR Properties dialog box under the Style heading.
When a GATOR oscillator is drawn on a chart, a trader can analyze its information and try to interpret it correctly.
GATOR does not produce direct trading signals, but, as it detects a market price trend's presence or absence, the oscillator can be used as an auxiliary technical analysis tool confirming or denying trading signals of other indicators.
The GATOR oscillator's values are calculated automatically using the following formulas:
Upper Gator = Jaw - Teeth
Lower Gator = -(Absolute negative value of (Teeth - Lips))
where:
Upper Gator - is the GATOR value of the line or bar above the centerline.
Lower Gator - is the GATOR value of the line or bar below the centerline.
Jaw - is the longer-period ALLIGATOR value.
Teeth - is the medium-period ALLIGATOR value.
Lips - is the shorter-period ALLIGATOR value.