OBOS (Overbought/Oversold Indicator)
OBOS (Overbought/Oversold Indicator) is an oscillator developed by the FXCM company especially for foreign exchange trading.
It is intended to reflect how actively an instrument is being traded and highlight the periods when it is overbought or oversold.
For every period, two values are calculated (the mathematical formula is provided later in the article). On a chart, the first values form Line 1 and the second values form Line 2.
The two lines move up and down in the same direction crisscrossing each other from time to time. In Marketscope, for every period, the space between the values of the lines is filled with color forming a
bar. By default, the bars going up (that is Line 1 going up) are green, and the bars going down (that is Line 1 going down) are red. Periodically, you can see blue bars. It happens in a succession of either
green or red bars when the last bar is smaller than the immediately preceding one, its high and low prices stay within the span of the high and low prices of the preceding bar.
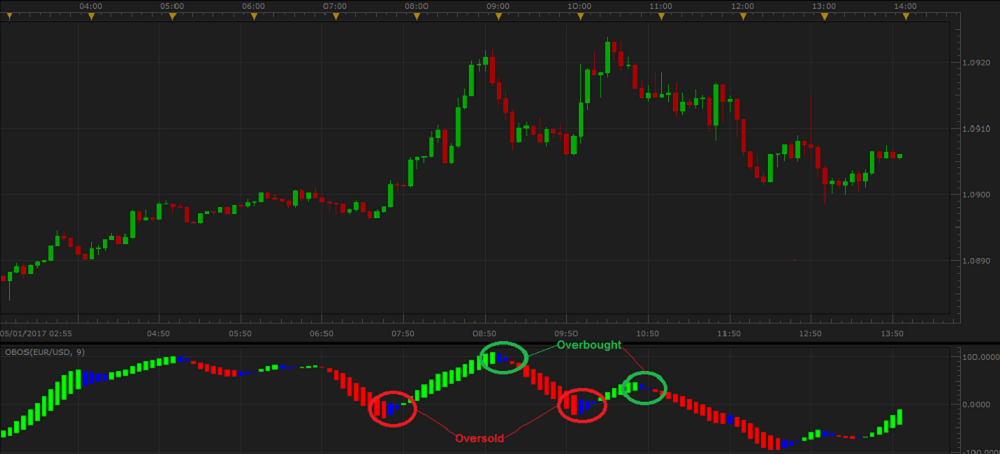
On the following picture, you can see an example of the OBOS oscillator drawn in an additional area below the market price chart.
Please remember that the OBOS oscillator uses the historical data for its calculation, and all the information it provides belongs to the past. Indicators do not predict the market price future behavior. A trader
can only suppose that the past tendencies will continue to develop in the same way for some time in the future and try to use this supposition appropriately.
To apply an OBOS oscillator to a chart, a trader needs to follow the procedure common to all Marketscope indicators. For more information, see the Add Indicator article.
During the procedure, a trader can customize the oscillator by specifying its parameters in the Properties dialog box. For more information, see the Change Indicator Properties
article.
The parameters fall into two groups:
- Calculation - the parameters needed to calculate an indicator's prices.
- Style and Appearance - the parameters needed to specify the way an indicator appears on a chart.
The OBOS oscillator has only one Calculation parameter - Number of periods. The parameter allows to specify the number of periods, over which the oscillator is to be calculated. The possible
values can be any. The default value is 9.
The parameter is available on the Parameters tab of the OBOS Properties dialog box under the Calculation heading.
When an OBOS oscillator is drawn on a chart, a trader can analyze its information and try to interpret it correctly. OBOS produces several trading signals:
- Overbought signal
An instrument is overbought when OBOS on its way up (a stretch of green bars) generates blue bars. It can be a signal of the price trend reversal downwards and a need to consider closing of long positions and opening of short
ones.
- Oversold signal
An instrument is oversold when the oscillator generates blue bars on its way down (a stretch of red bars). It can be a signal of the price trend reversal upwards and a need to consider closing of short
positions and opening of long ones.
Please note that in its calculation, OBOS uses smoothing techniques several times. In our case, it is the technique of the Exponential Weighted Moving Average indicator. Thus, the oscillator's
trading signals are generated with a substantial delay. A trader should look for a confirmation of an actual trend reversal by other technical analysis tools.
The OBOS oscillator's values are calculated automatically using the following formula:
OBOS Line 1 = EMA{EMA[100 x (WPr-EMA(WPr)) / StdDev(WPr)]}
OBOS Line 2 = EMA(Line 1)
where:
WPr - is the current period weighted price calculated as follows:
WPr=(2 x Close+Low+High) / 4
EMA - is the Exponential Weighted Moving Average of a certain number of periods specified by the Numbers of periods parameter of the OBOS Properties dialog box.
StdDev - is a standard deviation value of WPr calculated over a certain number of periods specified by the Numbers of periods parameter of the OBOS Properties dialog box.
back