AD (Accumulation/Distribution)
AD (Accumulation/Distribution) is a volume oscillator that was developed by Mark Chaikin in 1970's. Besides AD, Chaikin developed CHO (Chaikin Oscillator) and CMF
(Chaikin Money Flow) oscillators that are listed among the standard indicators of Marketscope.
AD is intended to help detecting the market price trend direction and strength. It is also capable to forewarn of possible trend reversals.
For these purposes, AD measures the buying (accumulation) or selling (distribution) pressure on an instrument and presents the results as a line. The oscillator's values are obtained by, first,
determining the location of a period's closing price relative to its price range (the difference between the highest and lowest prices of a specified number of periods, over which the oscillator is calculated)
and, second, multiplying it by the period's volume of ticks (an instrument's price changes that happen every time when a certain number of trades take place on the market). (The mathematical formulas are
provided later in the article).
The running values of AD form its line that fluctuates above and below the zero line. The line rises when the oscillator's values are positive (uptrend) and falls when
they are negative (downtrend). The further away from the zero line the oscillator's values are, the stronger the respective trend is.
As a rule, the direction of the oscillator's line coincides with the direction of the market price trend, but sometimes the oscillator's line diverges from the market price trend's direction, thus,
forewarning of possible trend reversals.
AD is always drawn in an additional area below the market price chart.
On the following picture you can see an example of the AD oscillator.
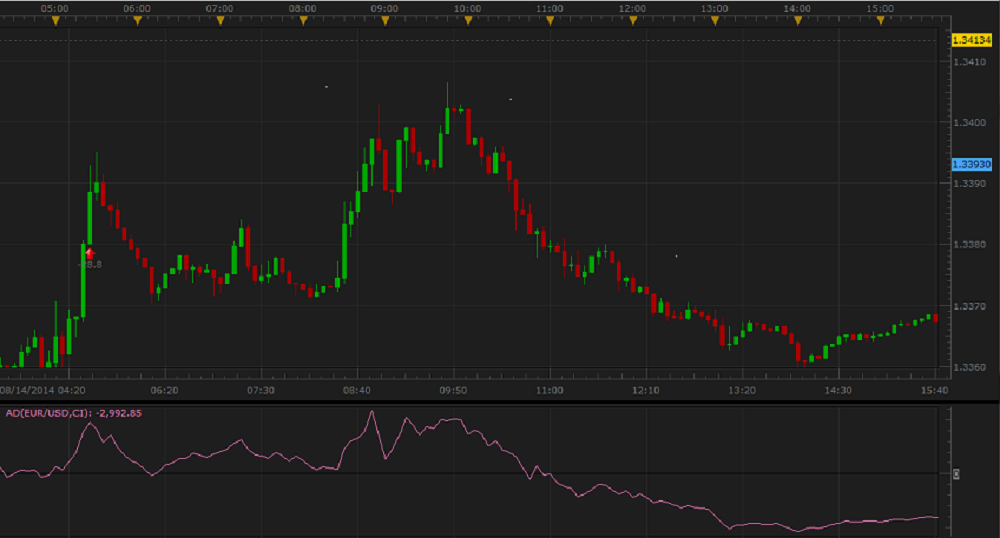
AD works best when a strong trend is present on the market. When the market moves sideways, it is better to refrain from trading or use some other technical analysis tools that your experience permits.
Another weakness of the oscillator is that it takes into account only the closing price of a period and does not "see" what happens inside or between the periods, over which the oscillator is calculated.
Therefore, it can overlook such important events as minor changes and gaps (when the bars of two consecutive periods do not overlap each other) of the market prices. Thus, though confirming of a buying or
selling pressure on an instrument's price trend is important, AD is generally not used as a stand-alone indicator. Mark Chaikin suggested using the oscillator in conjunction with other indicators that either
confirm the oscillator's signals or decline them.
Please remember that, in its calculation, the oscillator uses the historical data, and all the information it provides belongs to the past. A trader can only suppose that the past tendencies will continue to
develop in the same way for some time in the future and try to use them appropriately.
To apply an AD oscillator to a chart, a trader needs to follow the procedure common to all Marketscope indicators. For more information, see the Add Indicator
article.
During the procedure, a trader can customize an oscillator by specifying its parameters in the Properties dialog box. For more information, see the Change Indicator Properties
article.
The parameters fall into two groups:
- Calculation - the parameters needed to calculate an oscillator's prices.
- Style and Appearance - the parameters needed to specify the way an oscillator appears on a chart.
AD has only one Calculation parameter - Calculation mode. The parameter allows to specify the way the AD oscillator is to be calculated (see the formulas later in the article). The
Calculation mode parameter has three values:
- Classic - the implementation of the value makes the oscillator react to accumulation or distribution pressure changes very fast. Its line is choppy and crosses the zero line up and down very
often producing frequent trading signals.
- Classic Incremental - the implementation of the value results in incrementing the AD oscillator's value of the period being calculated with the AD value of the period immediately presiding it.
Thus, the oscillator becomes smoother and reacts to the pressure changes much slower. Its line is flatter and stays above or below the zero line for longer time resulting in fewer trading signals.
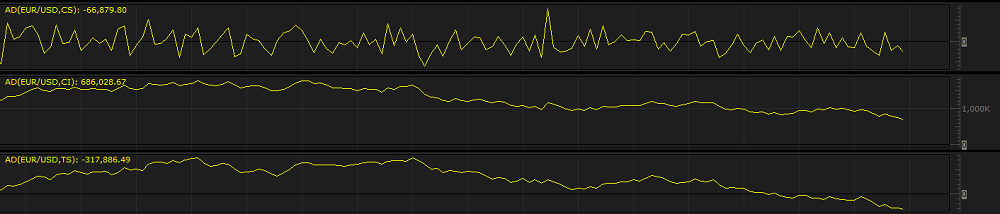
- Trade Station - the implementation of the value modifies the calculation of the oscillator's values a bit further (as compared to the Classic Incremental value). As a result, its line
resembles the one of the Classic Incremental value but stays closer to the zero line and crosses it more often resulting in trading signals that react to the pressure changes faster.
Traders choose this or that Calculation mode parameter's value in accordance with the way they plan to use the oscillator. The default value is Classic Incremental.
On the following picture, you can see how oscillators of different Calculation mode parameter's values look like on a chart.
The parameter is available on the Parameters tab of the AD Properties dialog box under the Calculation heading.
When an AD oscillator is drawn on a chart, a trader can analyze its information and try to interpret it correctly. AD produces two major trading signals (provided they are confirmed by other technical analysis
tools):
- Trend Confirmation
During a strong uptrend or downtrend, moving of the AD line away from the zero line in the same direction as the market price moves confirms the current trend.
- Divergences
Divergences occur when the market prices and the oscillator move in the opposite directions (divergence itself) or towards each other (more precisely called convergence, but in the article
we'll stick to the term divergence in both cases). It is a signal of a possible trend reversal. Divergences can be of two types:
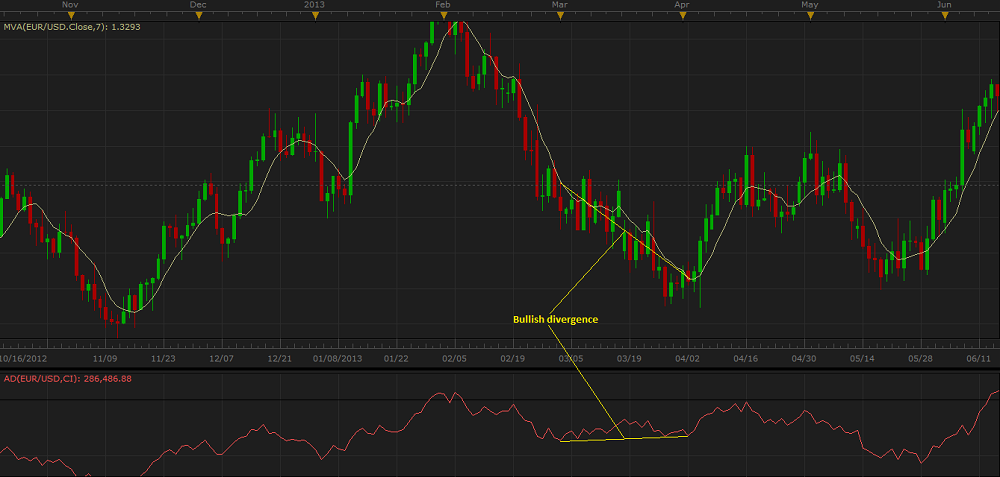
- Bullish divergence occurs when an instrument's prices move down, and the AD oscillator moves flat or up. This shows that the selling pressure on the instrument is becoming weaker that
can be treated as a warning of a bullish trend reversal and the need to consider closing of Sell positions and opening of Buy ones.
On the following picture, you can see an example of a bullish divergence.
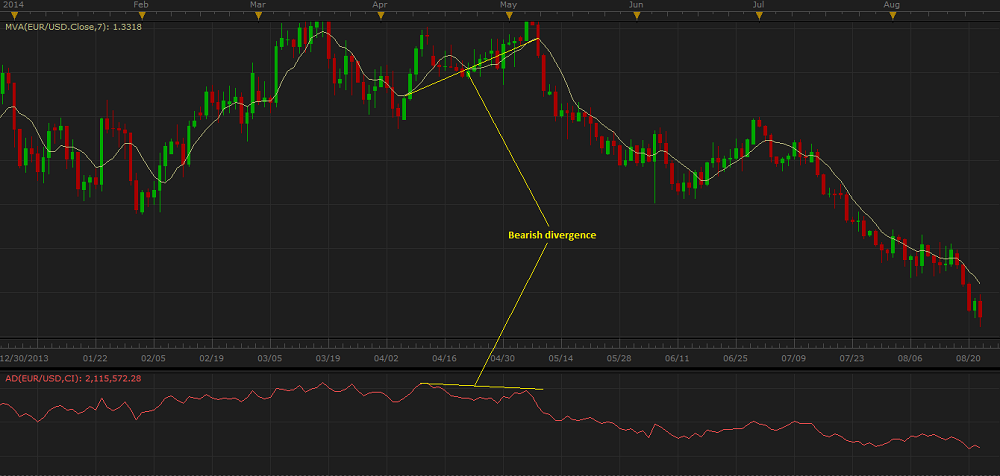
- Bearish divergence occurs when an instrument's prices move up, and the AD oscillator moves flat or down. This shows that the buying pressure on the instrument is becoming weaker that can
be treated as a forewarning of a bearish trend reversal and the need to consider closing of Buy positions and opening of Sell ones.
On the following picture, you can see an example of a bearish divergence.
Once a divergence takes place, a trader should look for a confirmation of an actual reversal. A divergence can be confirmed by means of different technical analysis tools such as trend-following indicators,
momentum oscillators, and chart patterns.
Please note that divergences are often misleading in a strong price trend: a bullish (or bearish) divergence can occur in a strong downtrend (or uptrend) and yet the strong downtrend (or uptrend) continues.
The AD oscillator's values are calculated automatically. The formulas to be used are specified by the Calculation mode values as follows:
Classic
AD = TV x [(Close - Low) - (High - Close)] / (High - Low)
where:
TV - is the tick volume of the period being calculated.
AD - is the oscillator's AD value of the period being calculated.
Close - is the closing price of the period being calculated.
Low - is the lowest price of the period being calculated.
High - is the highest price of the period being calculated.
Classic Incremental
ADi = ADi-1 + TVi x [(Closei - Lowi) - (Highi - Closei)] / (Highi - Lowi)
where:
ADi - is the oscillator's AD value of the period being calculated.
ADi-1 - is the oscillator's AD value of the period immediately preceding the one being calculated.
TVi - is the tick volume of the period being calculated.
Closei - is the closing price of the period being calculated.
Lowi - is the lowest price of the period being calculated.
Highi - is the highest price of the period being calculated.
Trade Station
ADi = ADi-1 + TVi x (Closei - Openi) / (Highi - Lowi)
where:
ADi - is the oscillator's AD value of the period being calculated.
ADi-1 - is the oscillator's AD value of the period immediately preceding the one being calculated.
TVi - is the tick volume of the period being calculated.
Closei - is the closing price of the period being calculated.
Openi - is the opening price of the period being calculated.
Highi - is the highest price of the period being calculated.
Lowi - is the lowest price of the period being calculated.
back