CHO (Chaikin Oscillator)
CHO (Chaikin Oscillator) is a volume oscillator that was developed by Mark Chaikin in 1970's. Besides CHO, Chaikin developed AD (Accumulation/Distribution) and CMF (Chaikin Money Flow) oscillators that are listed among the standard indicators of Marketscope.
CHO is intended to help detecting the market price trend's direction and strength. It is also capable to forewarn of possible trend reversals.
For these purposes, CHO measures the buying (accumulation) or selling (distribution) pressure on an instrument and presents the results as a line.
The oscillator's values are obtained by, first, calculating the AD oscillator's values, then, applying of fast and slow smoothening techniques to
the AD oscillator's values, and, finally, determining the difference between the fast and slow moving averages of the AD oscillator's values.
(The mathematical formulas are provided later in the article). A running total of the CHO values forms a line (or a histogram as a trader's choice
can be). The line fluctuates above and below the zero line. When the CHO values are above the zero line, the buying (accumulation) pressure prevails
over the selling (distribution) pressure forming an uptrend and vice versa. The further away from the zero line the oscillator's values are, the
stronger the respective trend is.
As a rule, the direction of the oscillator's line coincides with the direction of the market price trend, but sometimes the oscillator's line diverges from the market price trend's direction, thus, forewarning of possible trend reversals.
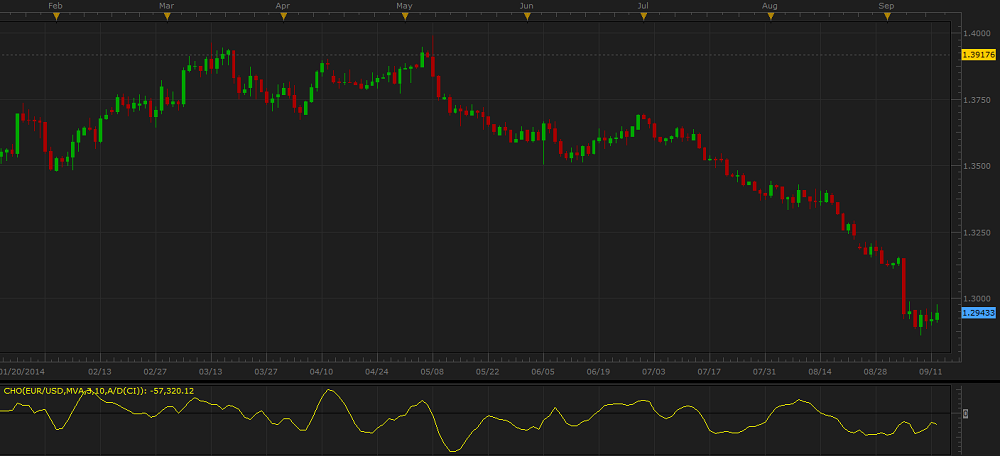
Please note that CHO is always drawn in an additional area below the market price chart.
On the following picture you can see an example of the CHO oscillator.
CHO works best when a strong market price trend is present. Though its ability of confirming a buying or selling pressure on an instrument's price trend is important, CHO is generally not used as a stand-alone indicator. Mark Chaikin suggested using the oscillator in conjunction with other indicators such as price envelope around a 21-day moving average and an overbought/oversold oscillator, such as RSI, that either confirm the CHO trading signals or decline them.
Please remember that as its Data Source the oscillator uses the data of another indicator (in our case, it is AD) that, in its turn, uses the historical data. Thus, all the information CHO provides belongs to the past. A trader can only suppose that the past tendencies will continue to develop in the same way for some time in the future and try to use the information appropriately.
To apply a CHO oscillator to a chart, a trader needs to follow the procedure common to all Marketscope indicators. For more information, see the Add Indicator article.
During the procedure, a trader can customize an oscillator by specifying its parameters in the Properties dialog box. For more information, see the Change Indicator Properties article.
The parameters fall into two groups:
In addition to the traditional Line color, Line width, and Line style parameters, the Style list includes three more entries:
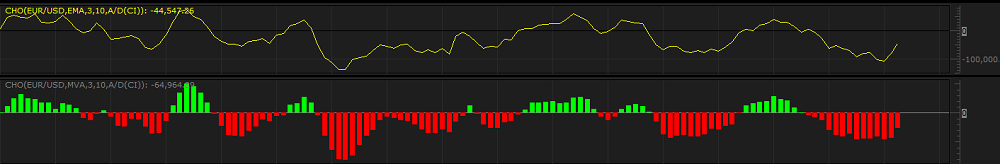
On the following picture, you can see examples of the CHO oscillator drawn as a line and histogram.
The parameters are available on the Parameters tab of the CHO Properties dialog box under the Style heading.
CHO has four Calculation parameters:
The parameters are available on the Parameters tab of the CHO Properties dialog box under the Calculation heading.
When a CHO oscillator is drawn on a chart, a trader can analyze its information and try to interpret it correctly. CHO produces two major trading signals (provided they are confirmed by other technical analysis tools):
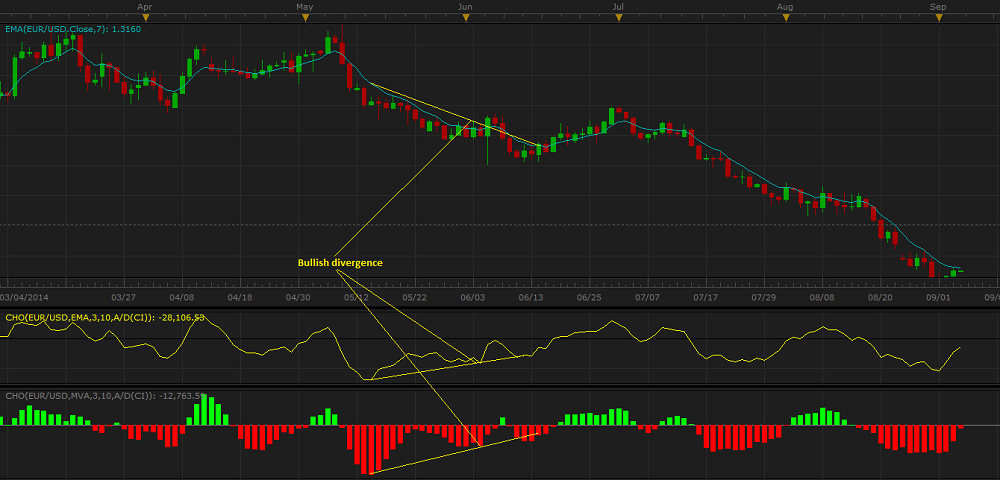
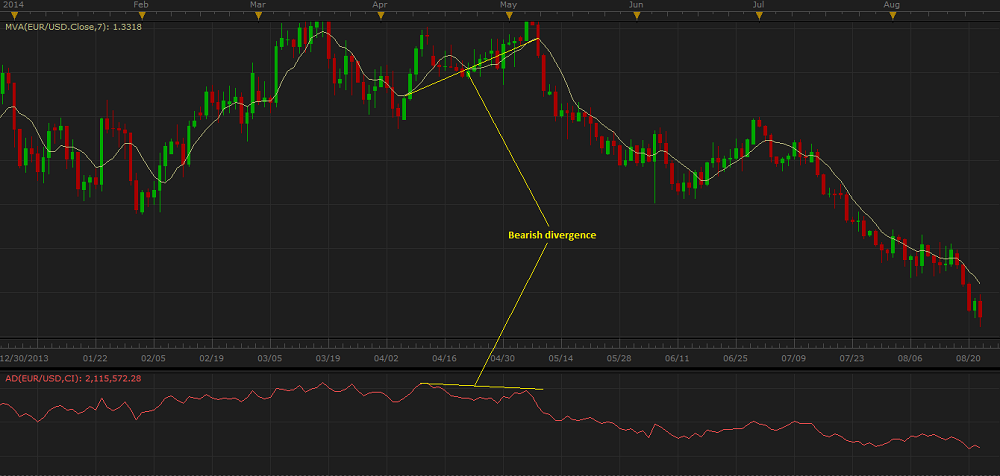
Once a divergence takes place, a trader should look for a confirmation of an actual reversal. A divergence can be confirmed by means of different technical analysis tools such as trend-following indicators, momentum oscillators, and chart patterns.
Please note that divergences are often misleading in a strong price trend. A bullish (or bearish) divergence can occur in a strong downtrend (or uptrend) and yet the strong downtrend (or uptrend) continues.
The AD oscillator's values are calculated automatically using the following formula:
CHO = Fast MA - Slow MA
where:
CHO - is the CHO value of the period being calculated.
Fast MA - is the AD oscillator's value (the calculation mode is specified by the A/D calculation mode parameter) of the period being
calculated that is smoothened by a shorter-period MA indicator of choice (the number of periods is specified by the Fast MA periods
parameter and the smoothing technique is specified by the Smoothing method parameter).
Slow MA - is the AD oscillator's value (the calculation mode is specified by the A/D calculation mode parameter) of the period being
calculated that is smoothened by a longer-period MA indicator of choice (the number of periods is specified by the Slow MA periods
parameter and the smoothing technique is specified by the Smoothing method parameter).