By adding an ARSI indicator to a chart, a trader gets a crisp picture of the market price trend's behavior that helps making informed trading decisions.
ARSI (Adaptive Relative Strength Index)
ARSI (Adaptive Relative Strength Index) is another useful indicator. It smooths the market noises and shows
the market trends more clearly.
To achieve the goals, the indicator filters out the market fluctuations
(noises) by averaging the price values of the periods, over which it is calculated. The values are calculated
automatically in a special way (the mathematical formulas are provided later in the article): in the process
of calculating every period's value, the indicator adapts the smoothing constant to the current period's RSI
value. As a result, ARSI becomes highly responsive to price changes, and it appears as though it moves
through the center of many of the sideways periods. This process is used for calculation of all the price
values of the indicator on the chart.
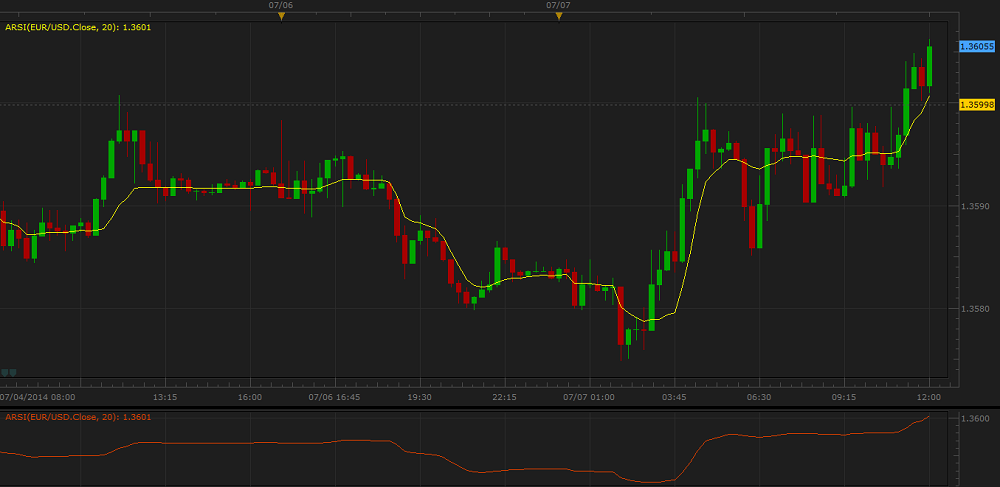
The ARSI indicator is drawn in the form of a line on the market price
chart or in an additional area below it.
On the following picture, you can see an example of ARSI drawn on the market price chart as well as in the
additional area below it.
By adding an ARSI indicator to a chart, a trader gets a crisp picture of the market price trend's
behavior that helps making informed trading decisions.
As all the other technical analysis indicators, the ARSI indicator works well only when certain factors influence the market. It is good on stable descending or ascending trends. Whereas in case of sideway market price movements, the ARSI indicator is useless as its line becomes horizontal, and a trader should refrain from any trading activity or, if the trading skills and experience permit, use special techniques such as pip-hunting.
Besides, the ARSI indicator uses the historical data for its calculation, and, as a result, it reveals the market trend that has already developed and does not show the future trend. A trader can only suppose that the past trend will continue to develop in the same direction for some time in the future and make appropriate trading decisions.
To apply an ARSI indicator to a chart, a trader needs to follow the procedure common to all Marketscope Indicators. For more information, see the Add Indicator article.
During the procedure, a trader can customize an indicator by specifying its parameters in the Properties dialog box. For more information, see the Change Indicator Properties article. The parameters fall into two groups:
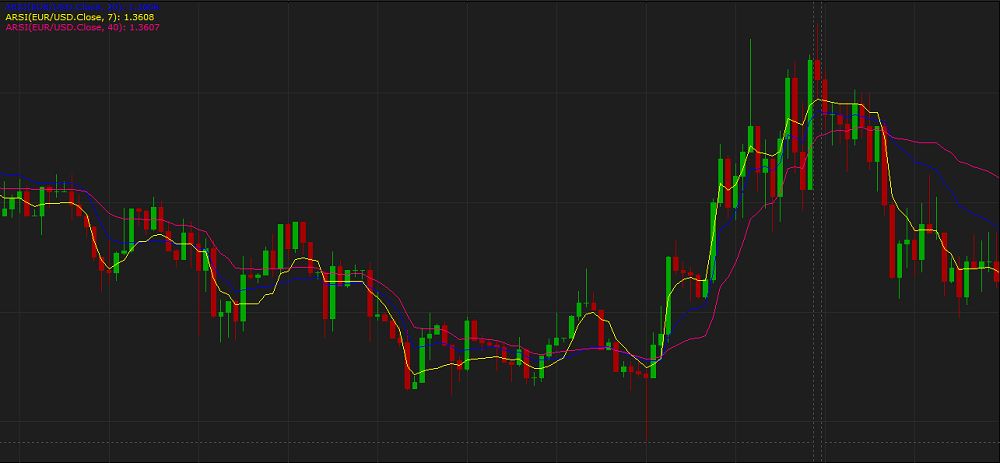
The ARSI indicator has only one Calculation parameter - Number of periods. The parameter allows specifying the number of periods, over which the indicator is to be calculated. The possible values are from 2 through 1,000. The default value is 14. The smaller the number is, the less market noises the indicator filters, and the faster it reacts to the market price changes. Its line stays closer to the price bars, thus, following the shorter-term market trends. The greater the number is, the more market noises the indicator filters, and the slower it reacts to the price changes. Its line stays more away from the market price bars, thus, following the longer-term market trends. Traders choose the Number of periods parameter's value in accordance with their trading tasks, strategies, and techniques. The commonly used value is 20.
On the following picture, you can see how indicators with different Number of periods parameter's
values look like on a chart:
The parameters are available on the Parameters tab of the ARSI Properties dialog box under the Calculation heading.
When an ARSI indicator is drawn on a chart, a trader can analyze its information and try to interpret it correctly. ARSI produces the following trading signals:
The Buy and Sell signals are provided by the direction of the trend line and not by its penetration of the price bars. Thus, when the indicator's line is moving upwards, consider opening of Buy positions. On the contrary, when the indicator's line is moving downwards, consider opening of Sell positions. Please note that, because ARSI is a fast indicator, it tends to get caught with a false signal at the end of each sustained price move. The 20-period moving average is reasonably smooth during such market segments and often demonstrates lagging typical of all trend-following indicators.
The ARSI indicator's values are calculated automatically using the following formulas:
ARSIi = ARSIi-1 + K x (Pricei - ARSIi-1)
where:
ARSIi - is the Adaptive Relative Strength Index value of the period being calculated.
ARSIi-1 - is the Adaptive Relative Strength Index value of the period immediately preceding the one
being calculated.
Pricei - is the Data Source price of the period being calculated.
K - is the smoothing constant calculated using the following formula:
K = |(RSIi / 100 - 0.5)| x 2
where:
RSIi - is the Relative Strength Index value
of the period being calculated.