ATR (Average True Range)
ATR (Average True Range) is a popular and widely used oscillator. It was developed by J. Welles Wilder
and introduced in his New Concepts in Technical Trading Systems book in 1978.
The ATR oscillator helps determining volatility of the market prices.
It is calculated in a simple way: the first value is an arithmetic mean one of N number of periods' True Ranges (TR). The
True Range is the greatest value of:
- The period's High minus Low.
- The absolute value of the period's High minus the immediately preceding period's
Close.
- The absolute value of the period's Low minus the immediately preceding period's
Close.
The values of all the other periods are calculated in accordance with a mathematical formula (the
formula is provided later in the article). On a chart, the ATR oscillator is drawn in the form of a line
in an additional area below the chart. The oscillator's line moves up when the volatility is growing
and down when it diminishes.
Note that the ASI oscillator is always drawn in an additional area below the market price chart.
On the following picture, you can see an example of the ATR oscillator.
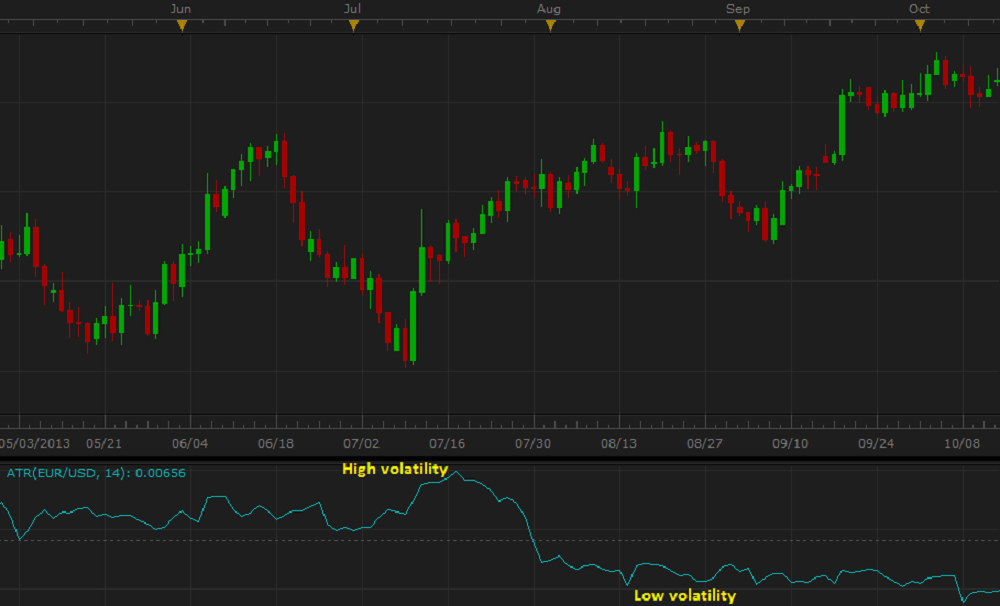
By adding the ATR oscillator, a trader gets a picture of the market price volatility: the higher the values of ATR are, the higher the market
volatility is, and the lower the values are, the lower the market volatility is. This information compliments well some other indicators, especially
trend-following ones such as MVA, EMA, etc.
It's worth mentioning that during its calculation certain smoothing takes place resulting in the oscillator's lagging behind the market price changes.
Note also that the ATR oscillator uses the historical data for its calculation and reveals the market price volatility of the past and cannot show the
one of the future. A trader can only suppose that the past volatility pattern will continue to develop the same way for some time in the future and
try to act in accordance with this supposition.
To apply an ATR oscillator to a chart, a trader needs to follow the procedure common to all Marketscope indicators. For more information, see
the Add Indicator article.
During the procedure, a trader can customize an oscillator by specifying its parameters in the Properties dialog box. For more information, see the Change Indicator Properties article.
The parameters fall into two groups:
- Calculation - the parameters needed to calculate an indicator's prices.
- Style and Appearance - the parameters needed to specify the way an indicator appears on a chart.
ATR has only one Calculation parameter - Number of periods. The parameter allows specifying the number of periods, over which the
oscillator is to be calculated. The possible values are from 2 through 1,000. The default value is 14. The smaller the number is the more
sensitive the oscillator becomes, and less lagging it produces. Its line obtains greater amplitudes and changes its direction more often.
The greater the number is, the less sensitive the oscillator becomes, and more lagging it produces. Its line obtains smaller amplitudes becoming
flatter. Traders choose the Number of periods parameter's value in accordance with their need of the level of sensitivity of the oscillator.
The recommended (Wilder's default) and most commonly used value is 14.
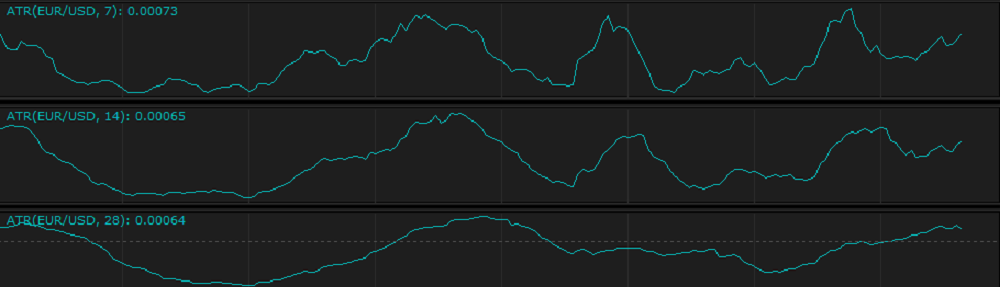
On the following picture, you can see how oscillators of different Number of periods parameter's values look like on a chart:
The parameter is available on the Parameters tab of the ATR Properties dialog box under the Calculation heading.
When an ATR oscillator is drawn on a chart, a trader can analyze its behavior and try to interpret it correctly. ATR reflects the market price
volatility and nothing else. It produces no direct trading signals. Its high values can be interpreted as a warning of a growing activity on the
market, the market price volatility, whereas, small values are typical of a slow activity on the market. Normally, the growing activity on the market
causes changes of the market situation such as a new trend development or ending of an old one. On the other hand, the decreasing activity leads to
consolidation of the market resulting in stabilization of a trend or establishing of a ranging market. Traders decide how to use the volatility
information based on their experience and knowledge. Don't forget the oscillator's ability to compliment other indicators' information.
Some traders apply two or more ATR oscillators with different Number of periods parameters to one chart and try to interpret the interrelation
of their lines.
The ATR oscillator's values are calculated automatically using the following formula:
ATRi = [ATRi-1 x (N - 1) + TRi] / N
where:
ATRi - is the Average True Range value of the period being calculated.
ATRi-1 - is the Average True Range value of the period immediately preceding the one being calculated.
TRi - is the True Range value of the period being calculated.
TR = max[(Highi - Lowi), | (Highi - Closei-1), | (Lowi - Closei-1)]
where:
N - is the Number of periods value.
back