MVA (Simple Moving Average)
MVA (Simple Moving Average, sometimes abbreviated as SMA) is one of the most popular and widely used indicators. It has been developed to smoothen the market noises and show the market trends more clearly.
To achieve the goals, the indicator filters out the market price fluctuations by averaging the indicator's values of the periods, over which it is calculated. The calculation process is simple and results in
obtaining arithmetic mean values. For example, to get the latest value of an MVA indicator calculated over a certain number (N) of periods, all prices of the N number of periods are added together, and then the
sum is divided by N: (Pi + Pi-1 + ... + Pi-N+1) / N.
By employing the MVA indicator, a trader gets a crisp picture of the market behavior and can make informed trading decisions. It is also good to use an MVA indicator in combination with another MVA indicator of
a different period length or other than MVA indicators.
At the same time, as all the other technical analysis indicators, the MVA indicator works well only when certain factors influence the market. It is good on stable descending or ascending trends. Whereas in case
of sideway market price movements, the MVA indicator is useless, and a trader should refrain from any trading activity or, if the trading skills and experience permit, use special techniques such as
pip-hunting, for example.
The MVA indicator has some weaknesses. In the calculation of every new period's price, only N number of prices can be involved. Therefore, every time a new price is being calculated, the earliest price
(Pi-N+1) drops off the N number of prices while the one of the current period (Pi) is added to it instead. It means that each and every price produces effect on an indicator's
calculation two times: when it appears and when it drops off. When the price appears, it reflects the current market behavior, and its impact on the period's price calculation is quite justified. By the time
the price has to drop off, it has already little to do with the immediate market situation but still impacts the current period's price calculation. Such double impact of one and the same price on an indicator's
calculation may cause false reflection of the real market situation. For example, when a spike price change occurs, its impact on the indicator's calculation is quite justified and reflects the reality of the
market behavior. But when after the N number of periods the price of the outstanding value drops off, it again produces a co-measurable impact on the calculation of the indicator, which is less justified
than in the case of its appearance. This can be considered as one of the drawbacks of the MVA indicator.
Another drawback of the MVA indicator is its inertia caused by the fact that all the prices are average values unable to react momentarily to sudden market price changes. In other words, the MVA indicator always
lags behind the market prices, reacts to the market price changes with a certain delay. The drawback of the MVA indicator's lagging has caused numerous attempts to solve the problem by developing new indicators
such as the EMA, LWMA, and SMMA indicators.
Besides, the MVA indicator uses the historical data for its calculation, and, as a result, reveals the market trend that has already developed and does not show the future trend. A trader can only suppose that
the past trend will continue to develop in the same direction for some time in the future and make appropriate trading decisions.
The MVA indicator is widely used as a calculation component of many other technical analysis indicators such as the BB (Bollinger Band), MACD, and
AC (Acceleration/Deceleration) indicators.
To apply an MVA indicator to a chart, a trader needs to follow the procedure common to all Marketscope indicators. For more information, see the Add Indicator article.
During the procedure, a trader can customize an indicator by specifying its parameters in the Properties dialog box. For more information, see the Change Indicator Properties
article.
The parameters fall into two groups:
- Calculation - the parameters needed to calculate an indicator's prices.
- Style and Appearance - the parameters needed to specify the way an indicator appears on a chart.
The MVA indicator has only one Calculation parameter - Number of periods. The parameter allows to specify the number of periods, over which the indicator is to be calculated. The possible values
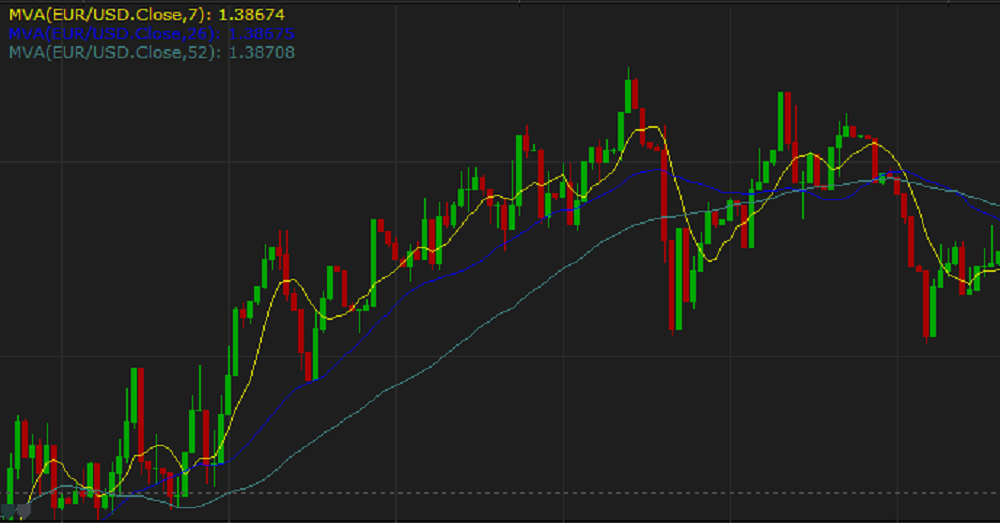
are from 1 through 10,000. The smaller the number is, the less market noises the indicator filters, and the faster it reacts to the market price changes. Its line stays closer to the market price bars, thus, following the shorter-term market trends and producing less lagging. The greater the number is, the more market noises the indicator filters, and the slower it reacts to the price changes. Its line stays more away from the price bars, thus, following the longer-term market trends and producing greater lagging behind the market prices. Traders choose the Number of periods parameter's value in accordance with their trading tasks, strategies, and techniques. The commonly used values are 7, 14, 26, and 52.
On the following picture, you can see how indicators with different Number of periods parameter's values look like on a chart:
The parameter is available on the Parameters tab of the MVA Properties dialog box under the Calculation heading.
When an MVA indicator is drawn on a chart, a trader can analyze its behavior and try to predict the beginning of a new market trend or ending of an old one, in other words, determine trend reversal points that
can serve as signals for the following actions:
- A steady descending trend is a signal to open Sell positions, and a steady ascending trend is a good signal to open Buy positions.
- If the market price movement is sideways, and the indicator's lines are more or less parallel to each other, it is best not to take any actions at all and wait for good signals.
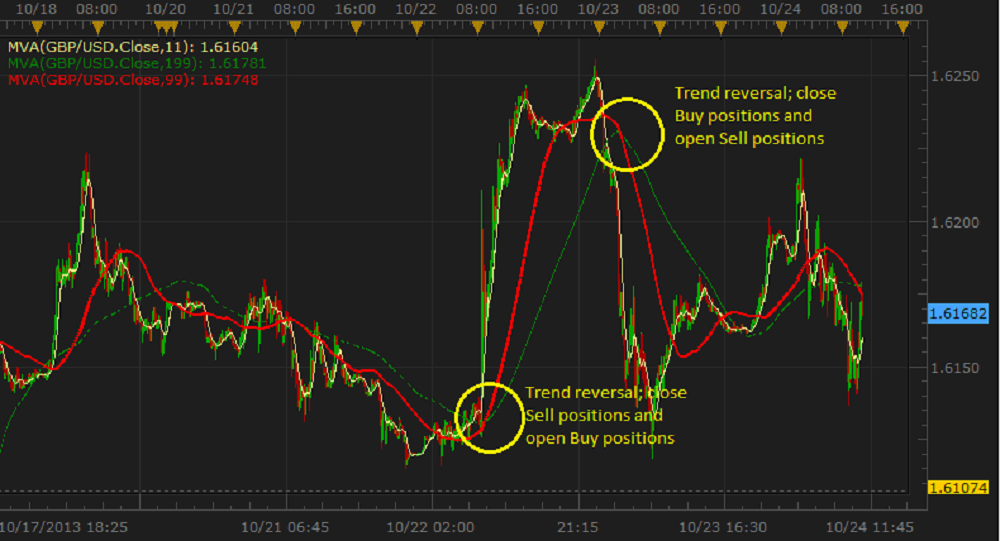
- When two or more indicators with a different number of periods are applied to a chart, and the line of an indicator with a smaller number of periods crosses over the line of an indicator with a greater
number of periods from above, it is a signal of a possible trend reversal, and a trader can either close Buy positions or open Sell ones.
- When two or more indicators with a different number of periods are applied to a chart, and the line of an indicator with a smaller number of periods crosses over the line of an indicator with a greater
number of periods from below, it is a signal of a possible trend reversal, and a trader can either close Sell positions or open Buy ones.
Please note that an MVA indicator can have the Number of periods' parameter equal to 1. In this case, its calculated value is equal to the market price value. In other words, the market
price presentation can be considered as an MVA indicator with the Number of periods' parameter equal to 1. On the following picture, you can see two lines of the MVA indicators with the
Number of periods' parameters equal to 26 and 52, and the price bars interacting with them as an indicator with the Number of periods' parameter equal to 1.
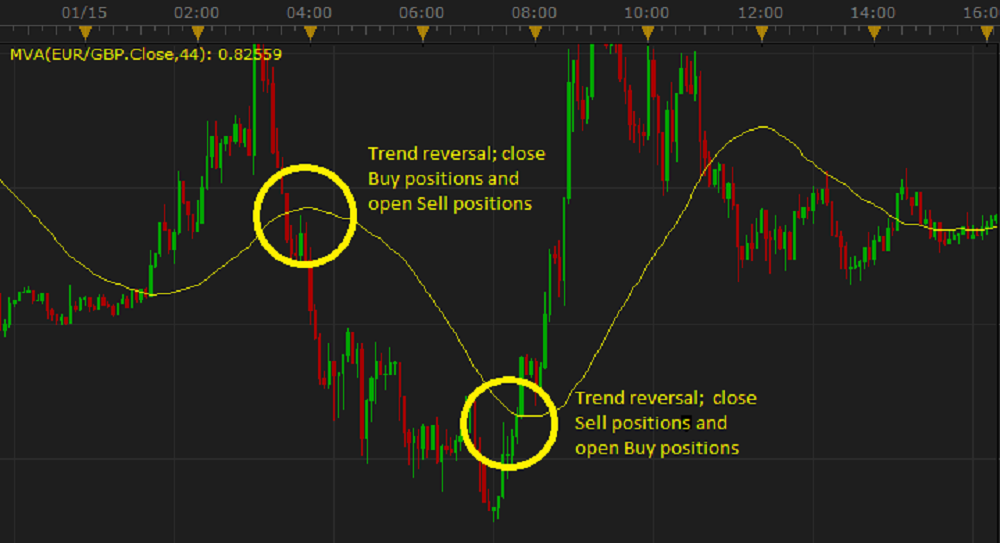
- When only one indicator is applied to a chart, crossing over of its line by the market prices produces the same signals as the ones described in the two immediately preceding statements.
The MVA indicator's values are calculated using the following formula:
MVAi = (Pricei + Pricei-1 + ... + Pricei-N+1) / N
where:
MVAi - is the MVA value of the current period being calculated.
Price - is the source (Close or other) price of any period participating in the calculation.
N - is the number of periods, over which the indicator is calculated.
back