BB is not meant to be used as a stand-alone indicator. John Bollinger recommends using it in conjunction with trend, volume, and other indicators as an additional confirmation of their signals.
BB (Bollinger Band)
BB (Bollinger Band) is a popular indicator that was developed by John Bollinger in early 1980's and presented in his book Bollinger Capital Management.
BB is intended for monitoring of the market price volatility. Volatility takes place when the price deviates from its average level and starts moving up
and down generating uptrends and downtrends. The greater the deviation is, the higher the volatility is.
Hence, for monitoring the market volatility, BB calculates average price and standard deviation volumes. The values are calculated automatically
(the mathematical formulas are provided later in the article) and allow drawing three lines (bands) on a chart that are:
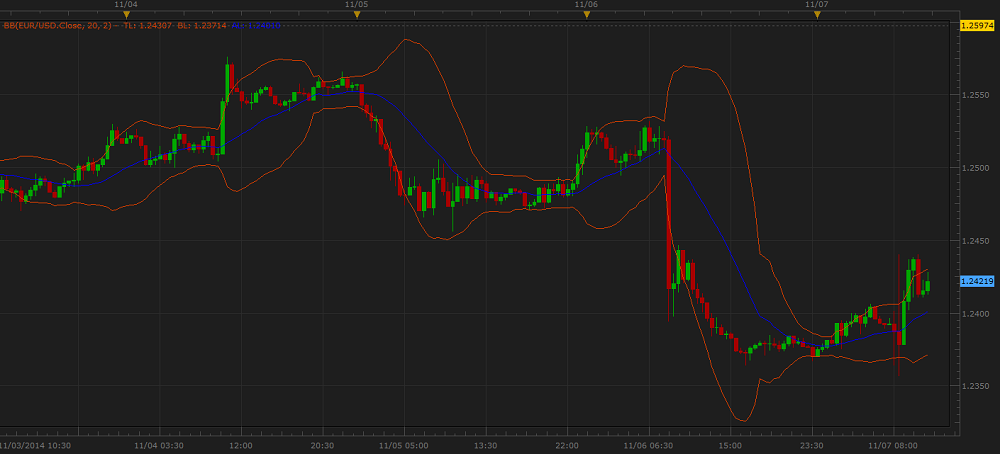
On the price chart, the Band lines deviate from the Average line when the market volatility increases and, conversely, the Band lines move towards the Average line when the market volatility decreases. Note that the indicator can be drawn on the market price chart as well as in an additional area below it.
On the following picture, you can see an example of the BB indicator drawn on the market price chart.
BB is not meant to be used as a stand-alone indicator. John Bollinger recommends using it in conjunction with trend, volume, and other indicators
as an additional confirmation of their signals.
Please remember that as its Data Source the indicator uses the historical data and provides the information that belongs to the past. A trader can only suppose that the market situation will continue to develop in the same way for some time in the future and try to use the supposition appropriately.
To apply a BB indicator to a chart, a trader needs to follow the procedure common to all Marketscope indicators. For more information, see the Add Indicator article.
During the procedure, a trader can customize the indicator by specifying its parameters in the Properties dialog box. For more information, see the Change Indicator Properties
article.
The parameters fall into two groups:
BB has the following Calculation parameters:
The parameters are available on the Parameters tab of the BB Properties dialog box under the Calculation heading.
BB has the following Style parameters:
The parameters are available on the Parameters tab of the BB Properties dialog box under the Style heading.
When a BB indicator is drawn on a chart, a trader can analyze its information and try to interpret it correctly. BB does not produce direct trading signals. It is true that BB reflects the market price direction with its Average line and volatility with its upper and lower Band lines. Prices are considered to be relatively high when they are above the upper (Top) band line and relatively low when below the lower (Bottom) band line. Likewise, when prices continually touch the upper (Top) band line, they are thought to be overbought and, conversely, when they continually touch the lower (Bottom) band line, the prices are thought to be oversold. However, to be treated as trading signals, these indications should be confirmed by some other technical analysis tools before trader decides to take a trading action.
The BB indicator's values are calculated automatically using the following formulas:
AL = MVA
TL = AL + (SD x N)
BL = AL - (SD x N)
where:
AL - is the Average line value of the period being calculated.
MVA - is the MVA indicator's value of the period. The number of periods, over which it is to be calculated, is specified by the
Number of periods parameter.
TL - is the Top band line value of the period being calculated.
SD - is the standard deviation value of the period being calculated. The number of periods, over which it is to be calculated, is specified
by the Number of periods parameter.
N - is the number of standard deviations, over which the line is shifted above or below the Average line.
BL - is the Bottom band line value of the period being calculated.