CCI (Commodity Channel Index)
CCI (Commodity Channel Index) is a very popular and widely used oscillator. It was developed by Donald Lambert and featured in the Commodities
(now Futures) magazine in October of 1980.
Lambert originally developed CCI to identify cyclical turns in commodities, but the oscillator works well in forex, too. CCI is intended to
identify new trends or extreme conditions of the market, such as very high or very low prices and overbought or oversold instruments.
For these purposes, CCI calculates the difference between the current period's typical price and the average typical price over a certain number
of periods (14 by default). The difference value is then divided by a certain percentage (Lambert's choice is 0.015%) of the mean typical price
deviation over the same number (14 by default) of periods. The values are calculated automatically in a special way (the mathematical formulas are
provided later in the article) and are presented in the form of an oscillator in an additional area below the price chart.
The oscillator chart has
two adjustable level lines (by default set at -100 and +100) and a zero line. The CCI line fluctuates above and below the zero line moving into
positive or negative territories. Moving in the positive territory (above the zero line) indicates strength of the market momentum, and moving in the
negative (below the zero line) territory indicates its weakness. The position of the line relative to the level lines allows identifying the market extremes,
such as very high or very low prices. The farther away from the zero line the CCI line is, the greater the extreme values of the market prices are. The values above the +100 or below -100 level lines may also
indicate overbought or oversold conditions of an instrument.
On the following picture, you can see an example of CCI (with all its important level lines).
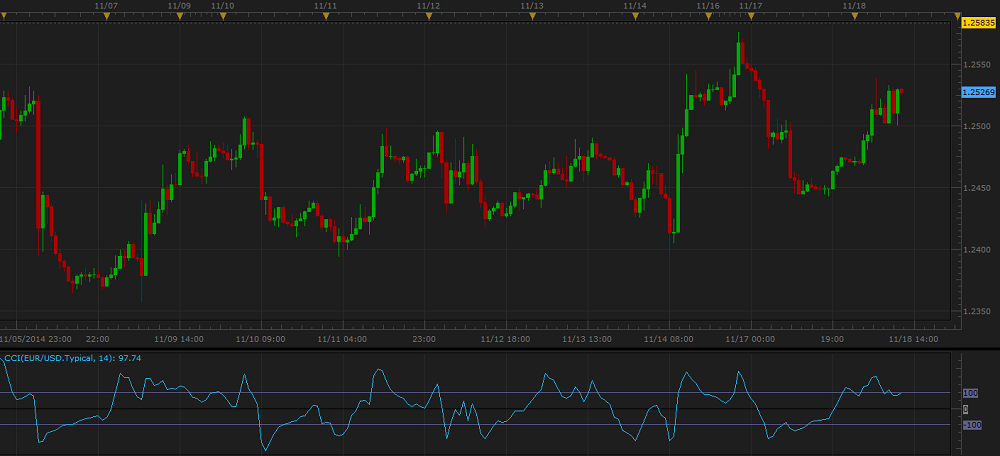
As you can see, most of the CCI values (according to Donald Lambert, 70 - 80%) stay within the limits of -100 and +100 level lines.
The rest 30 - 20% of the CCI values reach beyond the level lines indicating extremes. With CCI being an unbounded oscillator, these extreme values
can continue to grow and are not supposed to reverse having crossed the level lines. Thus, the prices reaching beyond the level lines can signal
both an emerging of a trend or its reversal. That's why CCI requires to be used in conjunction with additional technical analysis tools to confirm
interpretation of its signals.
Note that CCI is used by many traders as a stand-alone oscillator providing trading signals on its own (read later in the article).
Please remember that the CCI oscillator uses the historical data for its calculation and all the information it provides belongs to the past.
A trader can only suppose that the past tendencies will continue to develop in the same way for some time in the future and try to use the
information appropriately.
To apply a CCI oscillator to a chart, a trader needs to follow the procedure common to all Marketscope indicators. For more information,
see the Add Indicator article.
During the procedure, a trader can customize an oscillator by specifying its parameters in the Properties dialog box. For more information, see the Change Indicator Properties article.
The parameters fall into three groups:
- Calculation - the parameters needed to calculate an indicator's prices.
- Style and Appearance - the parameters needed to specify the way an indicator appears on a chart.
- Levels - the parameters needed to specify the values of overbought and oversold level lines (as well as the way they appear on a chart).
The CCI oscillator has only one Calculation parameter - Number of periods. The parameter allows specifying the number of periods,
over which the oscillator is to be calculated. The possible values are from 2 through 1,000. The default value is 14. The smaller the
number is, the more sensitive the oscillator becomes. The greater the number is, the less sensitive the oscillator becomes. Traders choose the
parameter's value in accordance with their need of the level of sensitivity of the oscillator. The recommended and most commonly used value is the default one - 14.
The CCI oscillator has the following Levels parameters:
- Overbought level - the parameter allows to specify at what level the +100 line is to be drawn. The possible values are from -1,000
through 1,000. The default value is 100. The greater the value of the Overbought level parameter is, the higher the threshold
at which an instrument is considered to be overbought, and the less signals the oscillator produces. The recommended (Donald Lambert's default) and most commonly used value is 100.
- Oversold level - the parameter allows to specify at what level the -100 line is to be drawn. The possible values are from -1,000
through 1,000. The default value is -100. The smaller the value of the Oversold level parameter is, the lower the threshold at
which an instrument is considered to be oversold, and the fewer signals the oscillator produces. The recommended (Donald Lambert's default) and most commonly used value is -100.
Please note that you can specify the width, style, and color of the two lines by selecting the values of your choice under the same Levels
heading.
Note also that the zero line is always black and its color cannot be modified.
On the following picture, you can see how CCI oscillators of different Number of periods values with level lines of different
Overbought level and Oversold level values, colors, styles, and widths look like on a chart.
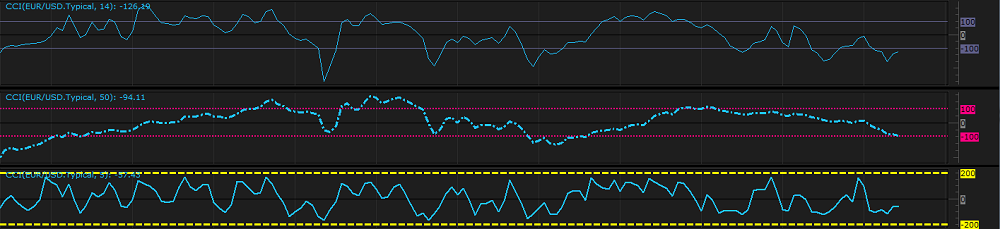
The parameters are available on the Parameters tab of the CCI Properties dialog box under the Calculation
(Number of periods) and Levels (Overbought level and Oversold level) headings.
When a CCI oscillator is drawn on a chart, a trader can analyze its information and try to interpret it correctly. According to Donald Lambert, CCI produces trading signals only when the oscillator's line
reaches either above the Overbought level line or below the Oversold level line. The main signals are:
- Level line crossing
- The oscillator's line rising above the Overbought level line can be a warning of an uptrend beginning and the need to consider opening of Buy positions. Do not forget to close the
opened Buy positions if the oscillator's line reverts and crosses back below the Overbought level line.
- The oscillator's line dropping below the Oversold level line can be a warning of a downtrend beginning and the need to consider opening of Sell positions. Do not forget to close the
opened Sell positions if the oscillator's line reverts and crosses back above the Oversold level line.
On the following picture, you can see examples of the Level line crossing signals.
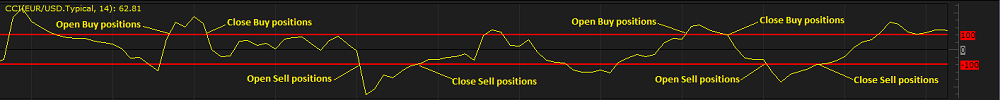
Note that CCI produces multiple Level line crossing signals, and many of them are premature. One of the solutions of the problem is using of other technical analysis tools in conjunction with the
oscillator, such as trend indicators that either confirm or deny a change in the trend direction.
- Overbought and Oversold Levels
Though the CCI oscillator is not range bound, it is also useful for identifying whether an instrument is overbought or oversold.
For this purpose, Lambert suggests to set the Overbought Level at +200, and the Oversold Level at -200. An instrument is
overbought when CCI exceeds the Overbought level, and it is oversold when the oscillator's line on the way down exceeds the Oversold level.
The scenarios produce the following trading signals:
- The CCI oscillator's line rising above the Overbought level can be a warning of a possible trend reversal downwards and the need to consider closing of Buy positions and opening of
Sell ones.
- The CCI oscillator's line dropping below the Oversold level can be a warning of a possible trend reversal upwards and the need to
consider closing of Sell positions and opening of Buy ones.
On the following picture, you can see examples of the Overbought and Oversold signals.

Note: An instrument can stay overbought or oversold for a long period of time. Therefore, if CCI crosses the Overbought or Oversold level, do not undertake immediate actions until the
oscillator's line crosses the level line in the opposite direction.
- Divergence
Divergence between the market price movement and the oscillator directions is a very strong signal of a trend reversal. The divergences can be of two types:
- Bullish divergence occurs when the CCI oscillator after having reached or crossed the Oversold level starts increasing, whereas the market price movement remains flat or
decreasing.
- Bearish divergence occurs when the CCI oscillator after having reached or crossed the Overbought level starts decreasing whereas the market price movement remains flat or
increasing.
On the following picture, you can see examples of the Divergence signals.
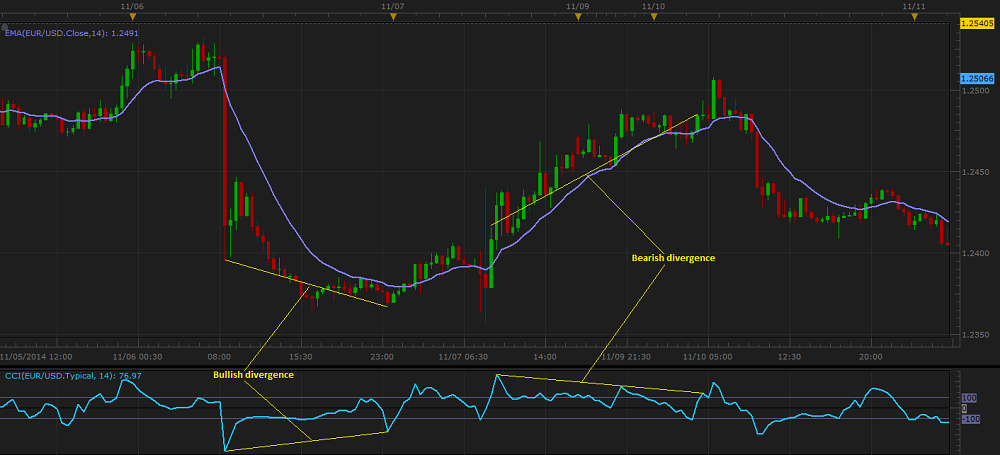
Please note that divergences are often misleading in a strong price trend: bullish (or bearish) divergences can occur in a strong downtrend
(or uptrend) and yet the strong downtrend (or uptrend) continues.
The CCI oscillator's values are calculated automatically using the following formulas:
CCI = (Typical Price - 20-period SMA of TP) / (.015 x Mean Deviation)
CCI = TP - MVAN / (.015 x MDN)
where:
CCI - is the Commodity Channel Index value of the period being calculated.
TP - is the Typical ((High + Low + Close)/3) price of the current period.
MVA - is the Simple Moving Average value of Typical prices of the current period calculated over N number of periods.
.015 - is Lambert's constant (Lambert set the constant at .015 to ensure that approximately 70 to 80 percent of CCI values would fall between
the -100 and +100 level lines.
MD - is the Mean Deviation of Typical prices of the current period calculated over N number of periods. To calculate the Mean
Deviation, first, subtract the most recent N - period average of the Typical price from each period's
Typical price. Second, take the absolute values of these numbers. Third, sum the absolute values. Fourth, divide by the total number of
periods (N).
N - is the number of periods, over which the MVA and MD values are calculated (both are set by the Number of periods parameter).
back