EW (Elliott Wave Indicator)
EW (Elliott Wave Indicator) is one of three Waves indicators included in the list of standard indicators of Marketscope (the other two are EWO (Elliott Wave Oscillator)
and EWN (Elliott Wave Number). The indicators help to apply Elliott Wave Theory to forex trading. The theory itself was developed by Ralph Nelson Elliott (1871 - 1948) in 1920s - 1930s and
covered most comprehensively in his major work Nature's Laws The Secret of the Universe in 1946.
Elliott Wave Theory asserts that crowd trading behavior ebbs and flows as waves in a sea and makes the market prices move in the same way. Based
on this ebb and flow nature of price movements, Elliott identified a certain fundamental wave structure (or pattern) consisting of a 5-wave motive
sequence (numbered 1, 2, 3, 4, and 5) followed by a 3-wave corrective sequence (lettered a, b, and c). In fact, Elliott Wave Theory is much more
complicated than this 5-3 combination, but in this article, we will mention only the very basics. Motive waves move in the direction of the market
trend. In an uptrend, rising waves are called impulse waves, and declining ones are called corrective waves. Conversely, in a downtrend, declining
waves are called impulse waves, and rising ones are called corrective waves. The underlying 5-3 pattern remains constant regardless of its time
frame. Any impulse wave comprises five motive waves of a smaller time frame, and any corrective wave consists of three corrective waves of a smaller
time frame.
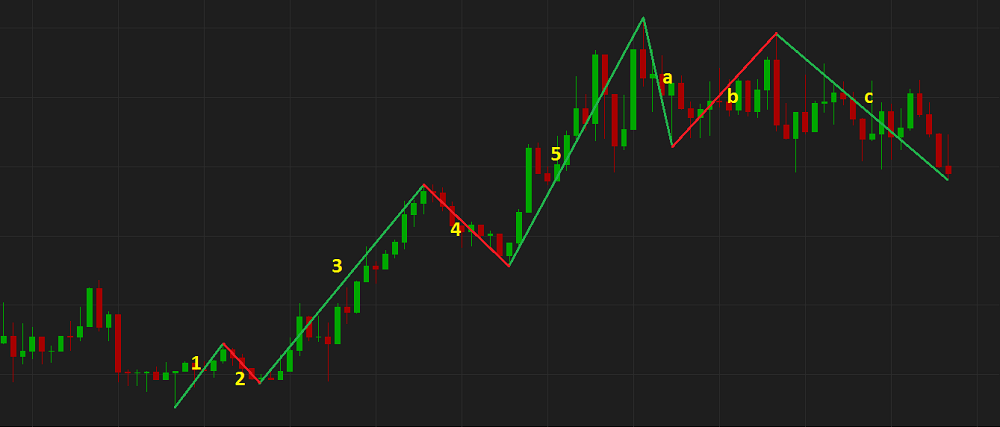
On the following pictures you can see examples of Elliott Waves on an uptrend price chart.
and on a downtrend price chart.
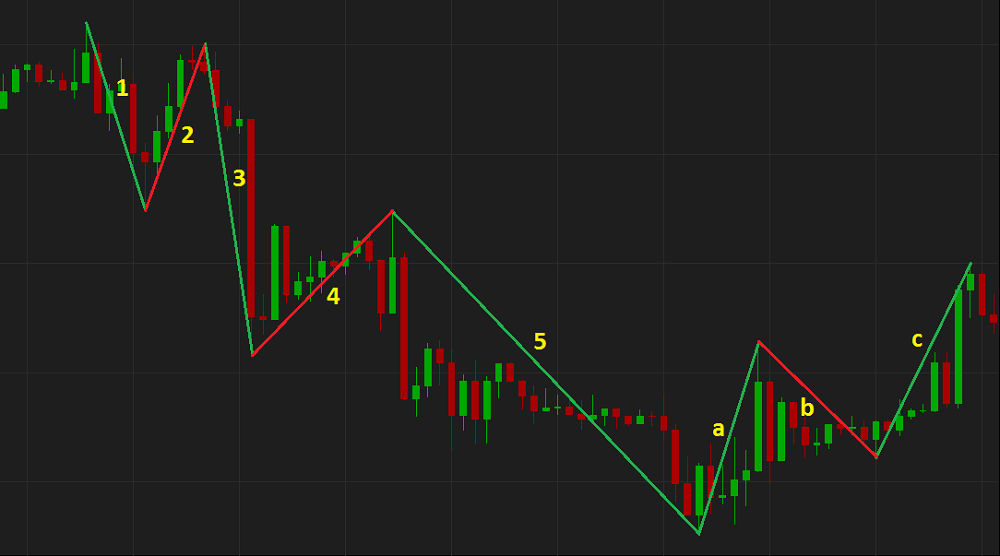
According to Elliott, the 5-wave motive sequence of an Elliott wave pattern must comply with the following three rules:
- Rule 1 - wave 2 cannot retrace more than 100 % of wave 1.
- Rule 2 - wave 3 can never be the shortest of the three impulse (numbered 1, 3, and 5) waves.
- Rule 3 - wave 4 can never overlap wave 1.
Besides the three rules that must hold true at all the time, Elliott worked out numerous guidelines, but in this article, we will mention only
three key ones:
- Guideline 1 - when wave 3 is the longest impulse wave of the motive sequence, wave 5 is approximately equal to wave 1.
- Guideline 2 - the forms of wave 2 and wave 4 alternate. If wave 2 is a sharp correction, wave 4 is a flat correction. Conversely,
if wave 2 is flat, wave 4 is sharp.
- Guideline 3 - after a 5-wave motive sequence (numbered 1, 2, 3, 4, and 5), its 3-wave corrective sequence (lettered a, b, and c)
usually ends in the area of the prior wave 4 low.
Elliott Wave Theory is very dependent on an accurate wave count. If any of the three rules does not hold true at any moment, a trader needs to begin
a new count. Moreover, even with accurate counts, a trader needs to re-evaluate and adjust counts as a new price emerges. Besides, determining where
one wave ends and a new one starts is extremely subjective. To offset the reliance on subjective wave counting, EW (Elliott Wave Indicator) and
other Wave indicators of Marketscope, (EWO (Elliott Wave Oscillator) and EWN (Elliott Wave Number)) have been developed.
Elliott Wave Indicator is intended to help determining where an Elliott wave ends and a new one starts (or in other words, determining when the
market price movement changes its direction) to form an Elliott wave pattern. It is achieved by assessing whether the calculated EW value meets
the requirements at which a price trend changes its direction or not. The values are calculated automatically (the assessment logics are provided
later in the article). On a chart, the values are presented as an oscillator with a horizontal line either above or below the zero line. The line
can be only +1 when it is above the zero line or -1 when it is below the zero line. The moment the value flips from one reading to the other the
line moves to the opposite position regarding the zero line warning about a possible price movement direction change.
Note that EW is always drawn in an additional area below the market price chart.
On the following picture, you can see an example of EW.
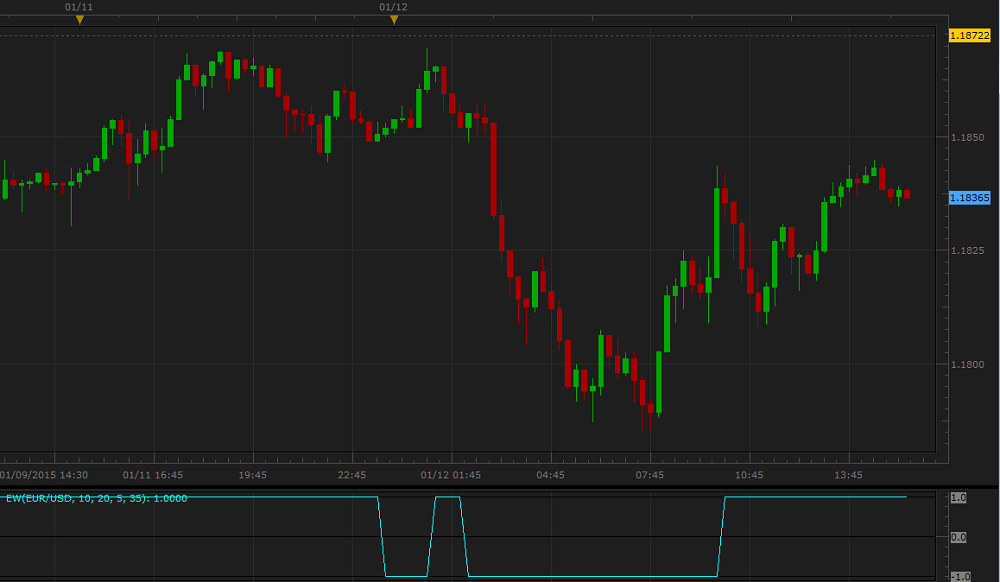
EW works best in a steady price trend in conjunction with the market price chart and other Waves indicators.
Please remember that as its Data Source the indicator uses the historical data and provides the information that belongs to the past. A trader
can only suppose that the market situation will continue to develop in the same way for some time in the future and try to use the supposition
appropriately.
To apply an EW to a chart, a trader needs to follow the procedure common to all Marketscope indicators. For more information,
see the Add Indicator article.
During the procedure, a trader can customize an indicator by specifying its parameters in the Properties dialog box. For more information, see the Change Indicator Properties article.
The parameters fall into two groups:
- Calculation - the parameters needed to calculate an indicator's prices.
- Style and Appearance - the parameters needed to specify the way an indicator appears on a chart.
EW has the following Calculation parameters:
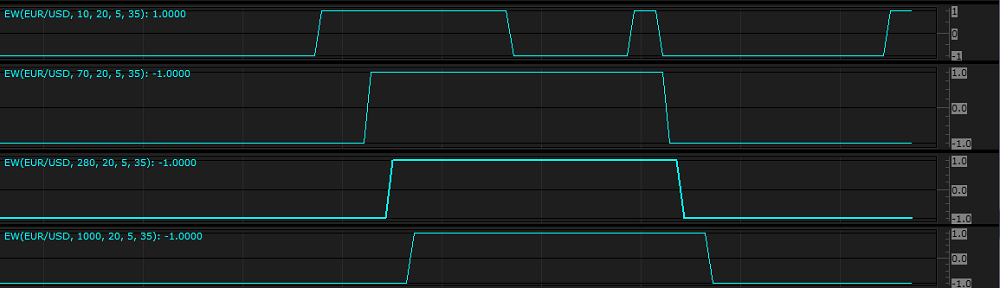
- Trigger value (%) - the parameter allows to specify the variable coefficient (percentage) to be used in calculation of the EW values.
The possible parameter's values are from 2 through 1,000. The default value is 70. The smaller the number is, the more sensitive the
oscillator is (the line changes its values between 1 and - 1 more often and reacts faster to the changes of the market price direction),
and vice versa.
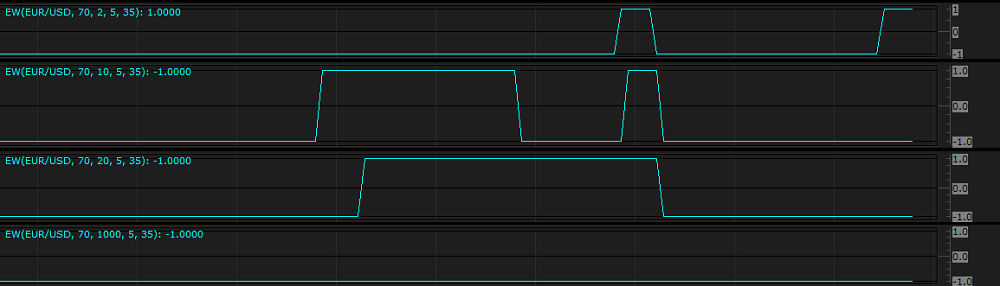
On the following picture, you can see examples of EW with different Trigger value (%) parameter values.
- Number of periods - the parameter allows to specify the number of periods, within the range of which the lowest and highest EW
values are to be selected. The possible parameter's values are from 2 through 1,000. The smaller the number is, the smaller the range
of EW values is, and vice versa. The default value is 20.
On the following picture, you can see examples of EW with different Number of periods parameter values.
- Fast Moving Average - the parameter allows to specify the number of periods, over which the shorter-period moving average indicator
is to be calculated. The possible parameter's values are from 2 through 1,000. The default value is 5. The smaller the number is,
the more sensitive the oscillator is, and vice versa. The most popular is the default value - 5.
- Slow Moving Average - the parameter allows to specify the number of periods, over which the longer-period moving average indicator
is to be calculated. The possible parameter's values are from 2 through 1,000. The default value is 35. The smaller the number is,
the more sensitive the oscillator is, and vice versa. The most popular is the default value - 35.
The parameters are available on the Parameters tab of the EW Properties dialog box under the Calculation heading.
When an EW oscillator is drawn on a chart, a trader can use its data in counting Elliott waves. As it is, EW does not produce any direct trading
signals.
The EW values are calculated automatically using the following formulas:
EW = 1 if LN < 0 and EWO < LN x T / 100
EW = -1 if HN > 0 and EWO > HN x T / 100
where:
EW - is the EW value of the period being calculated.
EWO - is the EWO
value of the period being calculated.
LN - is the lowest EWO value of the N-period range (N is specified by the Number of periods parameter).
TN - is the highest EWO value of the N-period range (N is specified by the Number of periods parameter).
T - is the variable coefficient used in calculation of the EW values (specified by the Trigger value (%) parameter).
back