EWO (Elliott Wave Oscillator)
EWO (Elliott Wave Oscillator) is one of three Waves indicators included in the list of standard indicators of Marketscope (the other
two are EW (Elliott Wave Indicator) and EWN (Elliott Wave Number)). The indicators help applying Elliott Wave Theory to forex trading.
The theory itself was developed by Ralph Nelson Elliott (1871-1948) in 1920s - 1930s and presented in his book The Wave Principle in 1938.
In 1939, it was summarized in a series of articles in the Financial World magazine, and finally covered most comprehensively in his major work
Nature's Laws: The Secret of the Universe in 1946.
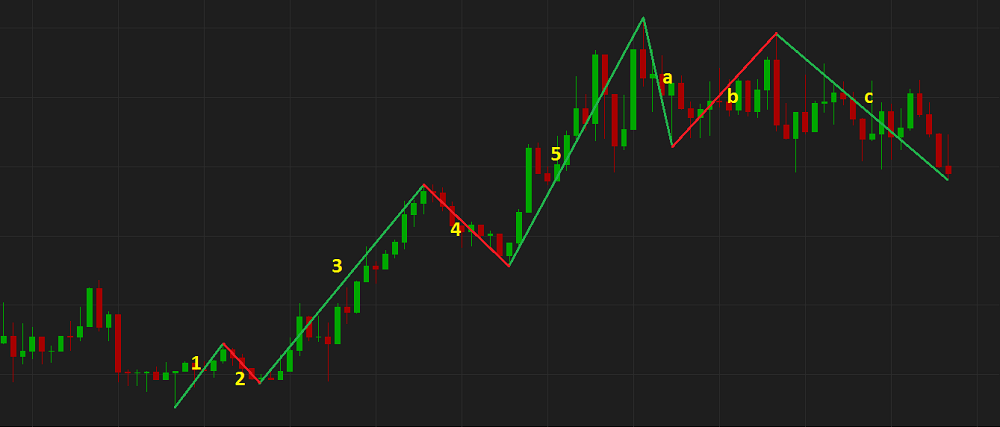
Elliott Wave Theory asserts that crowd trading behavior ebbs and flows as waves in a sea and makes the market prices move in the same way. Based on this ebb and flow nature of price movements, Elliott identified a certain fundamental wave structure (or pattern) consisting of a 5-wave motive sequence (numbered 1, 2, 3, 4, and 5) followed by a 3-wave corrective sequence (lettered a, b, and c). In fact, Elliott Wave Theory is much more complicated than this 5-3 combination, but we will focus only on the very basics. Motive waves move in the direction of the market trend. In an uptrend, rising waves are called impulse waves, and declining ones are called corrective waves. Conversely, in a downtrend, declining waves are called impulse waves, and rising ones are called corrective waves. The underlying 5-3 pattern remains constant regardless of its time frame. Any impulse wave comprises five waves of a smaller time frame, and any corrective wave consists of three waves of a smaller time frame.
On the following pictures you can see examples of Elliott Waves on an uptrend price chart.
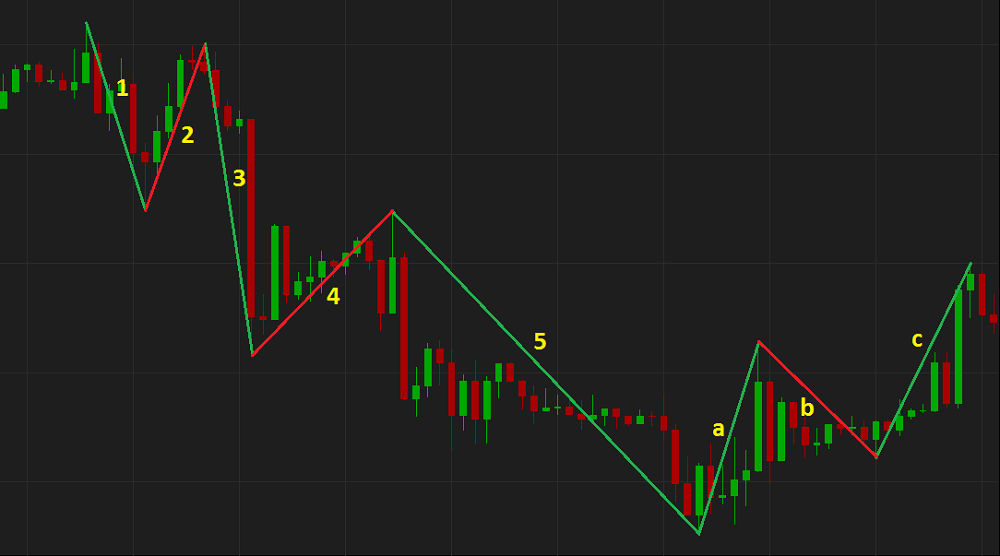
and on a downtrend price chart.
According to Elliott, the 5-wave motive sequence of an Elliott wave pattern must comply with the following three rules:
Besides the three rules that must hold true at all the time, Elliott worked out numerous guidelines, but in this article, we will mention only three key ones:
Elliott Wave Theory is very dependent on an accurate wave count. If any of the three rules does not hold true at any moment, a trader needs to begin a new count. Moreover, even with accurate counts, a trader needs to re-evaluate and adjust counts as a new price emerges. Besides, determining where one wave ends and a new one starts is extremely subjective. To offset the reliance on subjective wave counting, EWO (Elliott Wave Oscillator) and other Waves indicators of Marketscope (EW (Elliott Wave Indicator) and EWN (Elliott Wave Number)) have been developed.
Elliott Wave Oscillator is intended to help determining where an Elliott wave ends and a new one starts or, in other words, determining when the market price movement changes its direction (a reversal point) to form an Elliott wave. It is achieved by presenting of EWO values as a histogram's bars. The values are calculated automatically as the difference between the slow and fast moving averages of a period (the mathematical formulas are provided later in the article). On a chart, the bars are above the zero line when their values are positive and below the zero line when the values are negative. By default, a positive bar is light green if its value is greater (and the bar is longer) than the value of the immediately preceding one and dark green if its value is smaller (and the bar is shorter) than the value of the immediately preceding bar; a negative bar is light red if its value is smaller (and the bar is longer) than the value of the immediately preceding one and dark red if its value is greater (and the bar is shorter) than the value of the immediately preceding bar. The bars form waves above and below the zero line, and the tops and bottoms of the waves (when the bas change their color from light to dark green or red) usually coincide with price turning points.
Note that EWO is always drawn in an additional area below the market price chart.
On the following picture, you can see an example of EWO.
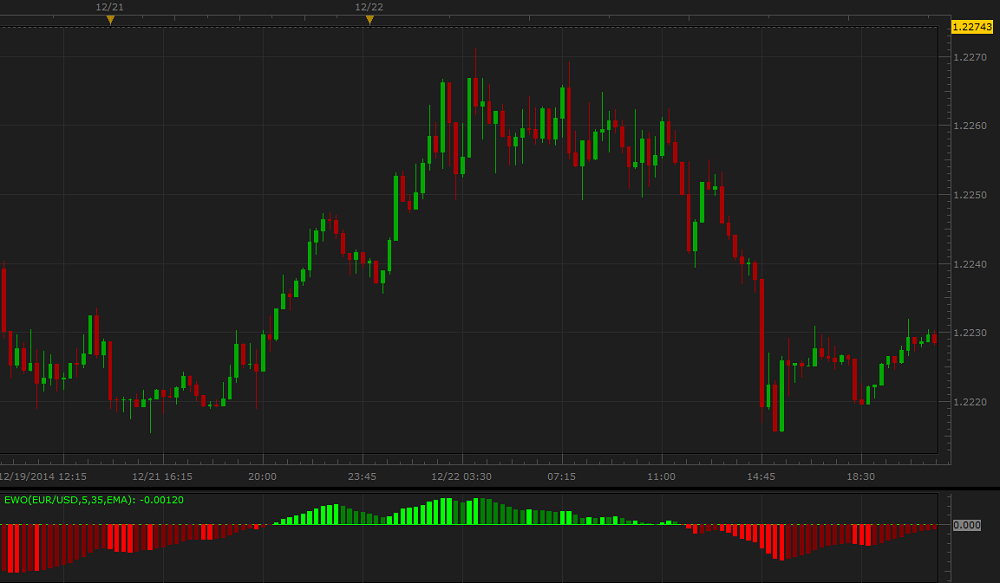
EWO works best in conjunction with the market price chart and other Waves indicators.
Please remember that as its Data Source the indicator uses the historical data and provides the information that belongs to the past. A trader can only suppose that the market situation will continue to develop in the same way for some time in the future and try to use the supposition appropriately.
To apply an EWO to a chart, a trader needs to follow the procedure common to all Marketscope indicators. For more information, see the Add Indicator article.
During the procedure, a trader can customize an indicator by specifying its parameters in the Properties dialog box. For more information, see the Change Indicator Properties article.
The parameters fall into two groups:
EWO has the following Calculation parameters:
The parameters are available on the Parameters tab of the EWO Properties dialog box under the Calculation heading.
EWO has the following Style parameters:
The parameters are available on the Parameters tab of the EWO Properties dialog box under the Style heading.
When an EWO is drawn on a chart, a trader gets a histogram and tries to use its data in counting Elliott waves. As it is, EWO does not produce any direct trading signals, but as it helps identifying Elliott Wave patterns (the highest point of the EWO histogram (positive for an uptrend and negative for a downtrend) signals wave 3), analysts believe that the following trading decisions can be taken:
The EWO values are calculated automatically using the following formula:
EWO = Fast MVA - Slow MVA
where:
EWO - is the EWO value of the period being calculated.
Fast MVA - is the shorter-period MVA value of the period being calculated (the number of periods is specified by the Fast MA
periods parameter).
Slow MVA - is the longer-period MVA value of the period being calculated (the number of periods is specified by the Slow MA
periods parameter).