It is good to use the oscillator in conjunction with the market price chart and other trend-following indicators that can confirm or deny the oscillator's trading information.
KRI (Kairi Relative Index)
KRI (Kairi Relative Index) is a popular momentum oscillator from the Marketscope list of standard indicators. It was developed in Japan by an unknown person long time ago.
KRI helps to monitor price momentum or, in other words, the rate (speed) of price changing. It is believed that momentum always foreruns and influences price changes. The greater the momentum is, the faster a price changes. The faster it changes, the stronger the price trend is.
KRI calculates its values as a percentage amount by which the current period's price differs from the period's MVA value (the mathematical formula is provided later in the article).
The calculation is performed automatically, and, as a result, certain values are obtained for each period.
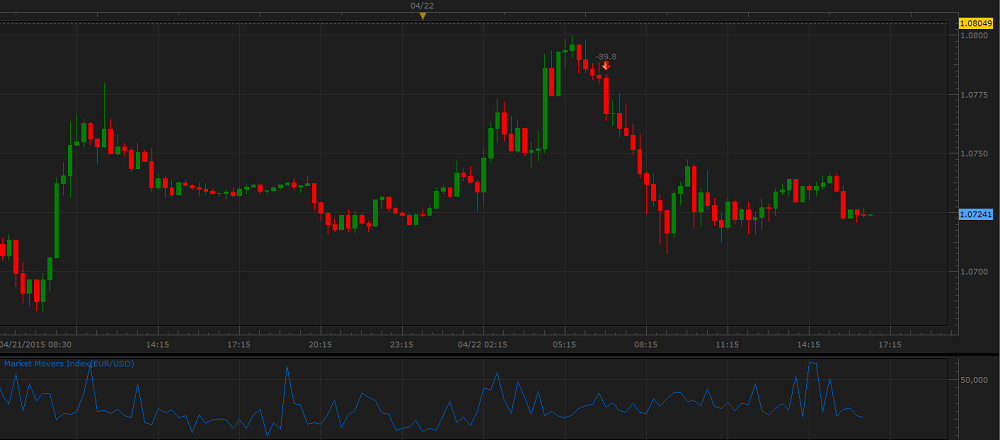
On a chart, KRI is drawn in the form of a line moving up and down above and below the zero line. When the oscillator's line goes up, an uptrend prevails. Conversely, when the oscillator's line goes down, a downtrend prevails. The farther away from the zero line the KRI line is, the stronger the price momentum is. Extreme values warm of oversold and overbought conditions of an instrument and possible trend reversals. The line's moving close to the zero line for a noticeable period of time suggests a sideways market presence.
Note that KRI, being an oscillator, is always drawn in an additional area below the market price chart.
On the following picture, you can see an example of KRI.
It is good to use the oscillator in conjunction with the market price chart and other trend-following indicators that can confirm or deny the oscillator's trading information.
Please remember that the KRI oscillator uses the historical data for its calculation, and all the information it provides belongs to the past. KRI does not predict the market price future behavior. A trader can only suppose that the past tendencies will continue to develop in the same way for some time in the future and try to use this supposition appropriately.
To apply a KRI indicator to a chart, a trader needs to follow the procedure common to all Marketscope indicators. For more information, see the Add Indicator article.
During the procedure, a trader can customize an oscillator by specifying its parameters in the Properties dialog box. For more information, see the Change Indicator Properties
article.
The parameters fall into two groups:
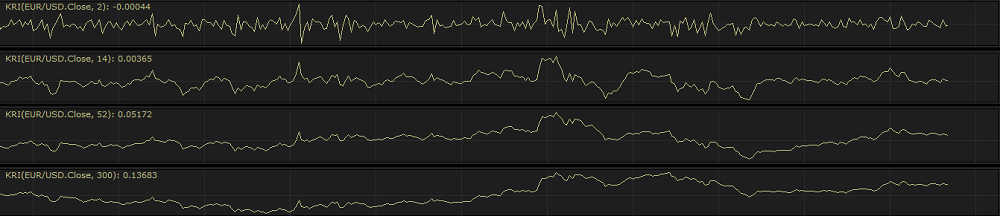
The KRI oscillator has only one Calculation parameter - Number of periods. The parameter allows specifying the number of periods, over which the MVA indicator's values (used in the KRI values calculation) are to be calculated. The possible values are from 2 through 1,000. The default value is 14. The smaller the number is, the more sensitive the oscillator becomes. Its line looks choppy and changes its direction more often. The greater the number is, the less sensitive the oscillator becomes. Its line is smoother and has smaller amplitude. Traders choose the Number of periods parameter's value in accordance with their need of the level of sensitivity of the oscillator. The most commonly used value is the default one - 14.
On the following picture, you can see how oscillators of different Number of periods values look like on a chart.
The parameter is available on the Parameters tab of the KRI Properties dialog box under the Calculation heading.
When a KRI oscillator is drawn on a chart, a trader can analyze its information and try to interpret it correctly. The Buy and Sell signals are provided by the direction of the oscillator's line. When the line is going upwards, consider opening of Buy positions. On the contrary, when the line is going downwards, consider opening of Sell positions. The line's extreme values near the upper and lower boarders of the chart signal possible trend reversals and the need to consider appropriate actions regarding opening and closing of trading positions. It is advised to confirm or deny the KRI information with other indicators' trading signals.
On the following picture, you can see examples of the KRI trading signals.

The KRI oscillator's values are calculated automatically using the following formula:
KRI = 100 x (Price - MVA) / MVA
where:
KRI - is the KRI oscillator's value of the period being calculated.
Price - is the Data Source price of the period being calculated.
MVA - is the MVA indicator's value of the current period.