LWMA (Linear Weighted Moving Average)
LWMA (Linear Weighted Moving Average) is one of the most popular and widely used indicators. It has been developed as an attempt to improve the MVA indicator, the major drawbacks of which
are its substantial lagging behind the market prices and double impact of one and the same price on the indicator's calculation. Both the indicators smoothen the market noises and show the market trends more
clearly.
To achieve the goals, the indicators filter out the market fluctuations (noises) by averaging the price values of the periods, over which they are calculated. But in the process of the LWMA indicator's
calculation, some extra value (weight) is added to the average price. This process is used for calculation of all the price values of the indicator on the chart. The greater weight allows the most recent
prices to play a more important role in the calculation, whereas, the importance of all the other preceding ones diminishes lineally. As a result, the LWMA indicator responds to the market price changes
faster making its lagging less significant than that of the MVA indicator. At the same time, as the importance of all the other preceding periods' prices diminishes, their second impact on the calculation
of a new period's price is less significant than it is in the case of the MVA indicator.
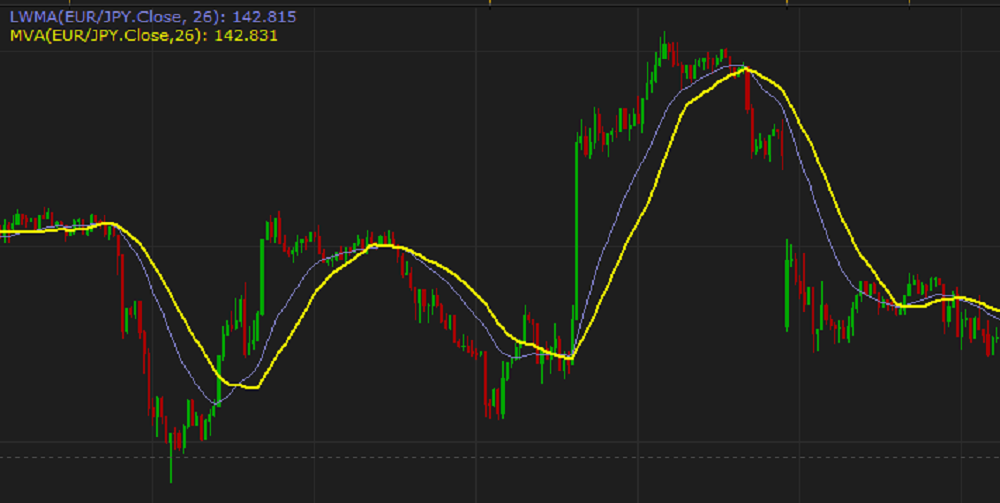
On the following picture, the blue line of the LWMA indicator of 26 periods reacts to the market price changes faster and stays closer to the price bars than the yellow line of the MVA indicator of the same
number of periods, thus, producing more accurate trading signals.
By employing the LWMA indicator, a trader gets a crisp picture of the market behavior and can make informed trading decisions.
It is also good to use an LWMA indicator in combination with another LWMA indicator of a different period length or other than LWMA indicators.
At the same time, as all the other technical analysis indicators, the LWMA indicator works well only when certain factors influence the market. It is good on stable descending or ascending trends. Whereas
in case of sideway market price movements, the LWMA indicator is useless, and a trader should refrain from any trading activity or, if the trading skills and experience permit, use special techniques, such as
pip-hunting.
Please note that the LWMA indicator uses the historical data for its calculation, and, as a result, it reveals the market trend that has already developed and does not show the future trend. A trader can only
suppose that the past trend will continue to develop in the same direction for some time in the future and make appropriate trading decisions.
The LWMA indicator is used as a calculation component of other technical analysis indicators, such as the HMA (Hull Moving Average) indicator.
To apply a LWMA indicator to a chart, a trader needs to follow the procedure common to all Marketscope indicators. For more information, see the Add Indicator article.
During the procedure, a trader can customize an indicator by specifying its parameters in the Properties dialog box. For more information, see the Change Indicator Properties
article.
The parameters fall into two groups:
- Calculation - the parameters needed to calculate an indicator's prices.
- Style and Appearance - the parameters needed to specify the way an indicator appears on a chart.
The LWMA indicator has only one Calculation parameter - Number of periods. The parameter allows to specify the number of periods, over which the indicator is to be calculated. The possible
values are from 2 through 1,000. The default value is 14. The smaller the number is, the less market noises the indicator filters, and the faster it reacts to the market price changes. Its line stays
closer to the price bars, thus, following shorter-term market trends and producing less lagging. The greater the number is, the more market noises the indicator filters, and the slower it reacts to the
price changes. Its line stays more away from the market price bars, thus, following longer-term market trends and producing greater lagging behind the market prices. A trader chooses the Number of periods
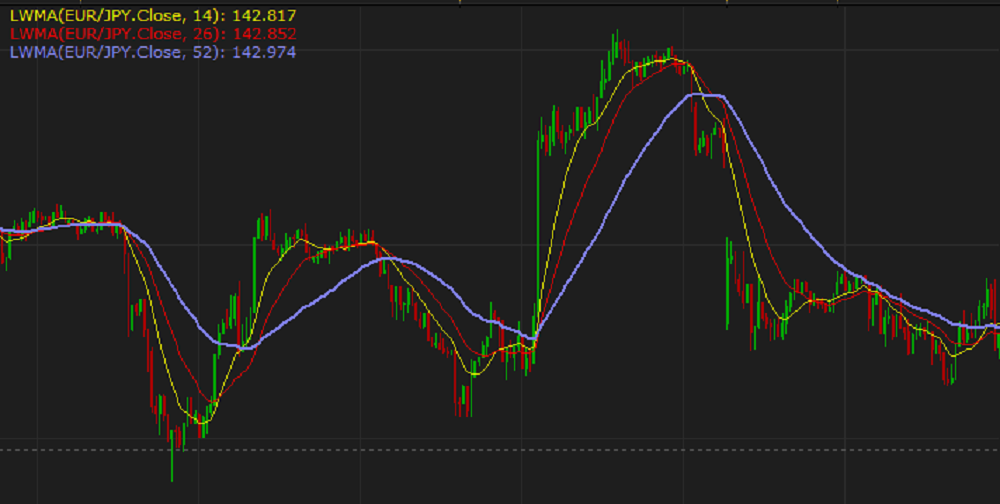
parameter values in accordance with his or hers trading tasks, strategies, and techniques. The commonly used values are 7, 14, 26, and 52.
On the following picture, you can see how indicators with different Number of periods parameters look like on a chart.
The parameter is available on the Parameters tab of the LWMA Properties dialog box under the Calculation heading.
When an LWMA indicator is drawn on a chart, a trader can analyze its behavior and try to predict the beginning of a new market trend or ending of an old one, in other words, determine trend reversal
points that can serve as trading signals similar to those of the indicator. For more information, see the MVA indicator article.
The LWMA indicator's values are calculated using the following formula:
LWMAi = Sum / SumWeight
Sum = Pricei x N + Pricei-1 x (N-1) + ... + Pricei-N+1 x (1)
SumWeight = N + (N - 1) +... x + 1 = N x (N + 1) / 2
where:
LWMAi - is the value of the current period being calculated.
Price - is the source (Close or other) price of any period participating in the calculation.
N - is the number of periods, over which the indicator is calculated.
back