MD (McGinley Dynamic)
MD (McGinley Dynamic) is one of trend-following standard indicators of Marketscope. It was developed by technician John R. McGinley in 1990 as an attempt to improve the performance of existing moving
average indicators, one of the major drawbacks of which was lagging behind the market prices, especially in fast-moving markets.
MD helps to determine an instrument's price trend presence and direction, but unlike the majority of moving average indicators, it does this job with greater accuracy (following price changes more closely) by
adjusting itself to accelerating or slowing (dynamic) market movements. To achieve this, the indicator adapts to the pace of trading by using variables instead of fixed time periods as moving average indicators
do (the mathematical formulas are provided later in the article). As a result, a line moving up and down is drawn on a chart. When the line goes up, an uptrend is present. Conversely, when the line goes down, a
downtrend is present. The line moving horizontally for a noticeable period of time suggests a sideways market presence.
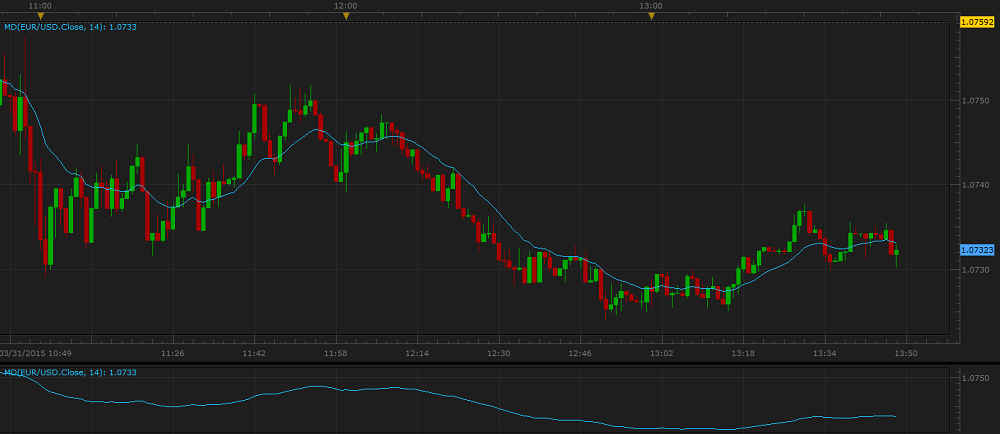
Note that the indicator can be drawn on the market price chart as well as in an additional area below it. MD builds its line without averaging any of its values. Thus, it is more responsive to the market changes
and does not exhibit as much lagging behind the prices as moving average indicators do.
On the following picture, you can see an example of the MD indicator drawn on the market price chart and in an additional area below it.
MD works best on stable descending or ascending market price trends.
It is good to use the McGinley dynamic indicator in conjunction with other trend-following indicators, especially such as MACD and RSI. Whenever a profit opportunity or
possible change in trend is spotted, lean on the McGinley dynamic indicator to confirm or reject the signal.
Please remember that MD uses the historical data for its calculation, and all the information it provides belongs to the past. A trader can only suppose that the market situation will continue to develop in the
same way for some time in the future and try to use this supposition appropriately.
To apply an MD indicator to a chart, a trader needs to follow the procedure common to all Marketscope indicators. For more information, see the Add Indicator article.
During the procedure, a trader can customize an indicator by specifying its parameters in the Properties dialog box. For more information, see the Change Indicator Properties
article.
The parameters fall into two groups:
- Calculation - the parameters needed to calculate an indicator's prices.
- Style and Appearance - the parameters needed to specify the way an indicator appears on a chart.
MD has only one Calculation parameter - Number of periods. The parameter allows to specify the number of periods, over which the indicator is to be calculated. The possible values are from 2
through 1,000. The default value is 14. The smaller the number is, the less market noises the indicator filters, and the faster it reacts to the market price changes. Its line stays closer to the price
bars, thus, following the shorter-term market trends. The greater the number is, the more market noises the indicator filters, and the slower it reacts to the price changes. Its line stays more away from the
market price bars, thus, following the longer-term market trends. Traders choose the Number of periods parameter's value in accordance with their trading tasks, strategies, and techniques. The commonly
used values are 7, 14, 26, and 52.
The parameter is available on the Parameters tab of the MD Properties dialog box under the Calculation heading.
MD builds its line without averaging any of its values. Thus, it is more responsive to the market changes and does not exhibit as much lagging behind the prices as moving average indicators do.
When an MD indicator is drawn on a chart, a trader can analyze its information and make use of the following trading signals:
- Uptrend indication
The trend is present when the price crosses the MD indicator line from below and stays above it while the indicator's line goes steadily upwards. It is advised to consider closing of Sell and
opening of Buy positions.
- Downtrend indication
The trend is present when the price crosses the MD indicator line from above and stays below it while the indicator's line goes steadily downwards. It is advised to consider closing of Buy and
opening of Sell positions.
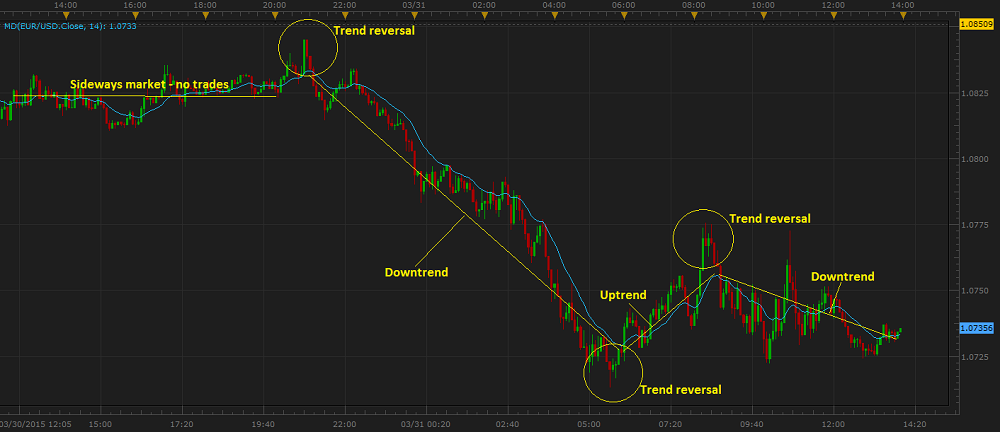
Note that the line indicates a Sideways market when it stays horizontal for a noticeable period of time. It is advised to refrain from trading activities.
- Trend reversals indication
When price bars deviate from the indicator's line excessively, it is a warning of a possible trend reversal.
On the following picture, you can see examples of the MD trading signals.
The MD values are calculated using the following formula:
MDI = MDi-1 + (PRICEi - MDi-1) / (0.6 x N x (PRICEi / MDI-1)4)
where:
MDi - is the MD value of the period being calculated.
MDi-1 - is the MD value of the period immediately preceding the current one.
PRICEi - is the Data Source price of the current period.
N - is the Number of periods parameter's value.
back