OSC (OSC Oscillator)
OSC (OSC Oscillator) is a very popular and widely used trend-following oscillator.
OSC is intended to reflect the market trend's presence, direction, momentum (or strength), and reversal points.
For these purposes, the OSC oscillator filters out the market fluctuations (noises) by employing
two MVA indicators of different number of periods (7 and 14 periods, by default) that average the price values of the periods, over which it is calculated, thus, showing the market trends more
clearly. The oscillator's values are calculated automatically as the difference between the longer- and shorter-term MVA indicators (the formula is provided later in the article). As a result, positive (when a
longer-term MVA's value is greater than the shorter-term one) or negative (when a longer-term MVA's value is smaller than the shorter-term one) values are obtained for each period. On a chart, the values are
drawn in the form of a line that moves up and down above and below the zero line. The zero line is formed by zero values of the oscillator (when a longer-term MVA's value is equal to the shorter-term one). The
positive values form the OSC line above the zero line and reflect the market price downtrend. Conversely, the negative values form the OSC line below the zero line and reflect the market price uptrend.
The father away from the zero line the OSC line is, the higher the trend's momentum is.
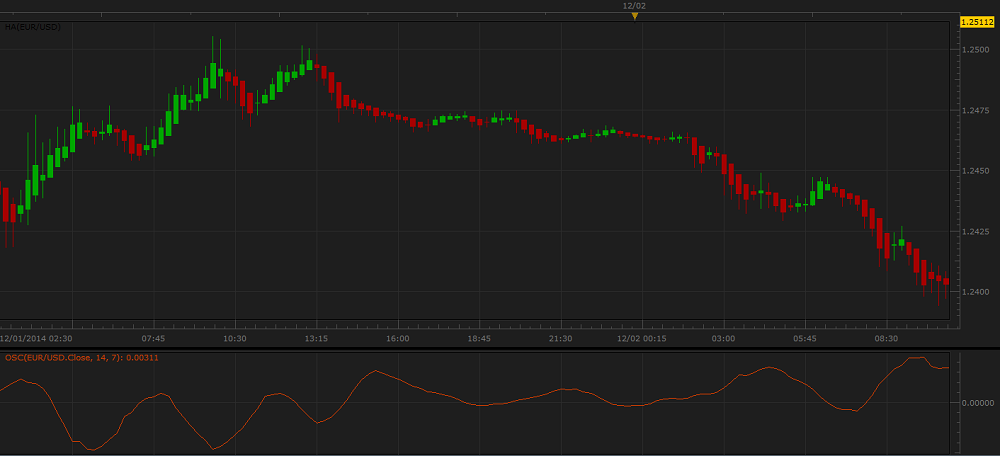
OSC is always drawn in an additional area below the market price chart.
On the following picture, you can see an example of OSC drawn in an additional area below the chart.
In its calculation, the oscillator employs the data of the MVA indicator that is considered to be lagging and, as a result, demonstrates some lagging behind the market price movement itself.
Please remember that the OSC oscillator uses the historical data for its calculation and all the information it provides belongs to the past. A trader can only suppose that the past tendencies will continue to
develop in the same way for some time in the future and try to use this supposition appropriately.
The OSC oscillator works well in company with a bar chart and other indicators.
To apply an OSC oscillator to a chart, a trader needs to follow the procedure common to all Marketscope indicators. For more information, see the Add Indicator article.
During the procedure, a trader can customize an indicator by specifying its parameters in the Properties dialog box. For more information, see the Change Indicator Properties
article.
The parameters fall into two groups:
- Calculation - the parameters needed to calculate an indicator's prices.
- Style and Appearance - the parameters needed to specify the way an indicator appears on a chart.
The OSC oscillator has two Calculation parameters:
- Short MVA - the parameter allows to specify the number of periods, over which the shorter MVA indicator's values (used in the calculation of the OSC line's values) are to be calculated. The
possible parameter's values are from 2 through 1,000. The default value is 7. The smaller the number is, the more sensitive the oscillator becomes, and vice versa. The most popular is the
default value - 7.
- Long MVA - the parameter allows to specify the number of periods, over which the longer MVA indicator's values (used in the calculation of the OSC line's values) are to be calculated. The
possible parameter's values are from 2 through 1,000. The default value is 14. The smaller the number is, the more sensitive the oscillator becomes, and vice versa. The most popular is the
default value - 14.
On the following picture, you can see how oscillators of different Short MVA and Long MVA values and various colors, styles, and widths look like on a chart.
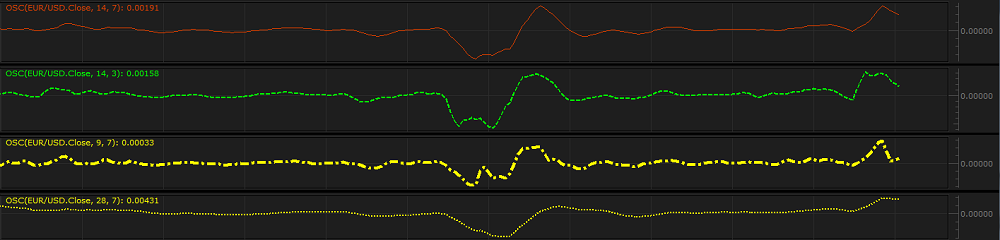
Note that the zero line is always gray and cannot be modified.
The parameters are available on the Parameters tab of the OSC Properties dialog box under the Calculation heading.
When an OSC oscillator is drawn on a chart, a trader can analyze its information and try to interpret it correctly. OSC produces the following trading signals:
- Zero line crossing
- The OSC line's crossing the zero line from below can be a warning of an downtrend beginning and the need to consider closing of Buy and opening of Sell positions.
- The OSC line's crossing the zero line from above can be a warning of an uptrend beginning and the need to consider closing of Sell and opening of Buy positions.
On the following picture, you can see examples of the Zero line crossing signals.
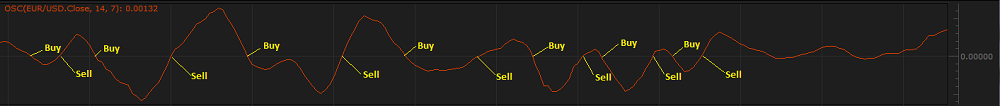
Note that OSC produces multiple Zero line crossing signals, and many of them are premature. One of the solutions of the problem is using of other technical analysis tools in conjunction with the
oscillator, such as trend following indicators that either confirm or deny a change in direction of the trend.
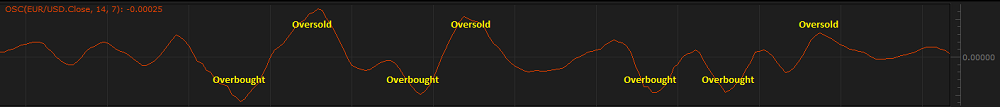
- Overbought and Oversold conditions
Though the OSC oscillator is not range bound, it is also useful for identifying whether an instrument is overbought or oversold. An instrument is overbought when the OSC line forms a deep bottom below
the zero line, and it is oversold when the oscillator's line peaks above the zero line. The scenarios produce the following trading signals:
- The OSC oscillator's line moves far below the zero line forming a deep bottom can be a warning of a possible trend reversal upwards and the need to consider closing of Sell positions and
opening of Buy ones.
- The OSC oscillator's line moves far above the zero line forming a peak can be a warning of a possible trend reversal downwards and the need to consider closing of Buy positions and opening of
Sell ones.
On the following picture, you can see examples of the Overbought and Oversold signals.
Note: An instrument can stay overbought or oversold for a long period of time. Therefore, if OSC forms a deep bottom (overbought) or high peak (oversold), do not take immediate trading decisions
until the bottom or peak is well shaped or confirmed by signals of other technical analysis tolls.
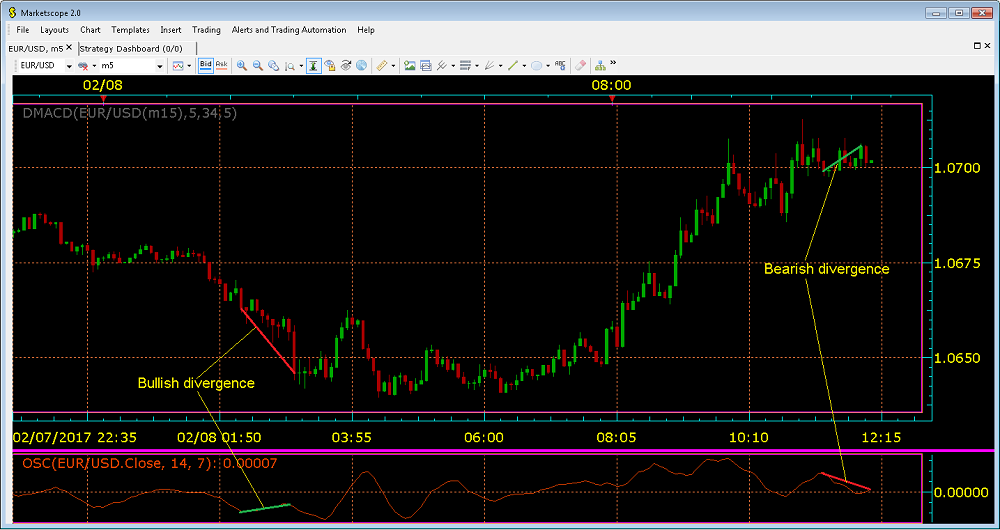
- Divergence
A divergence between the market price movement and the oscillator line directions is a very strong signal of a trend reversal. There are two types of divergences:
- Bullish divergence occurs when the CCI oscillator line moves upwards and the market price movement continues to remain flat or is heading downwards.
- Bearish divergence occurs when the CCI oscillator line moves downwards and the market price movement continues to remain flat or is heading upwards.
On the following picture, you can see examples of the Divergence signals.
Please note that divergences are often misleading in a strong price trend: bullish (or bearish) divergences can occur in a strong downtrend (or uptrend) and yet the strong downtrend (or uptrend)
continues.
The OSC oscillator's values are calculated automatically using the following formula:
OSC = Long MVA - Short MVA
where:
OSC - is the OSC value of the period being calculated.
Long MVA - is the value of a longer-term MVA calculated for the current period.
Short MVA - is the value of a shorter-term MVA calculated for the current period.
back