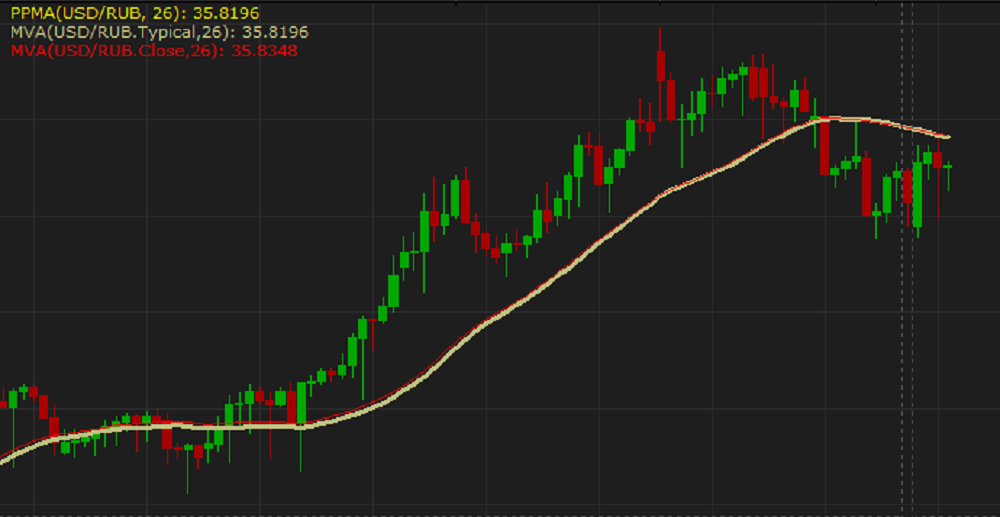
Note: The Pivot Point's value of a period coincides completely with the value of the Typical price from the Data source list that results in identical graphical presentations of the MVA and PPMA indicators on the chart. On the following picture the yellow line of the PPMA indicator of 26 periods coincides completely with the green line (it is even not seen on the chart being completely hidden under the yellow line of the PPMA indicator) of the MVA indicator with the Typical price source of the same number of periods, whereas, the red line of the MVA indicator with the Close price source of the same number of periods partially seen on the chart.
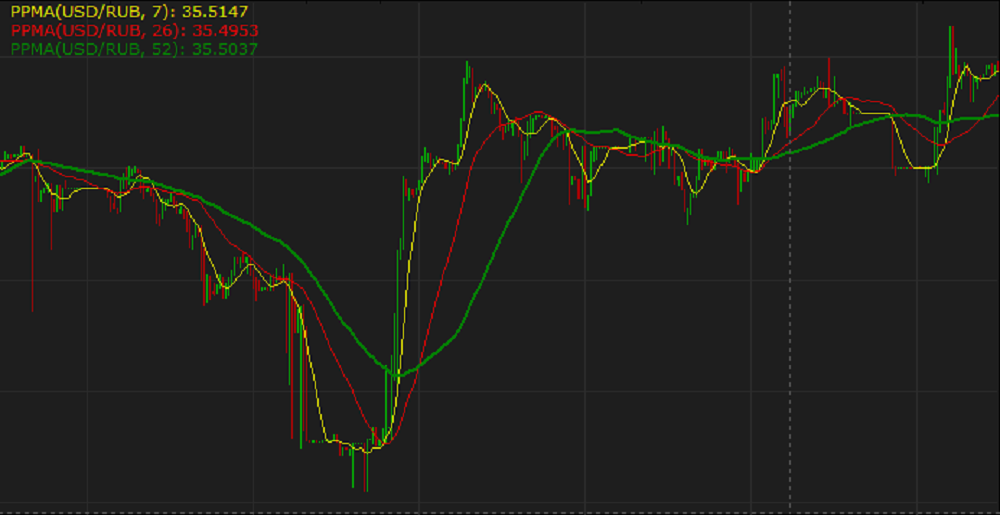
By employing the PPMA indicator, a trader gets a crisp picture of the market behavior and can make informed trading decisions. It is also good to use a PPMA indicator in combination with another PPMA indicator of a different period length or other than PPMA indicators.
As all the other technical analysis indicators, the PPMA indicator works well only when certain factors influence the market. It is good on stable descending or ascending trends. Whereas, in case of a sideway market price movement, the PPMA indicator is useless, and a trader should refrain from any trading activity or, if the trading skills and experience permit, use special techniques, such as pip-hunting, for example.
The PPMA indicator has some weaknesses. In the calculation of every new period's value, only N number of prices can be involved. Therefore, every time a new value is being calculated, the earliest one (PPi-N+1) drops off the N number of prices while the value of the current period (PPi) is added to it instead. It means that each and every value produces effect on an indicator's calculation two times: when it appears and when it drops off. When the value appears, it reflects the current market behavior, and its impact on the period's value calculation is quite justified. By the time the value has to drop off, it has already little to do with the immediate market situation but still impacts the current period's value calculation. Such double impact of one and the same value on an indicator's calculation may cause false reflection of the real market situation. For example, when a spike price change occurs, its impact on the indicator's calculation is quite justified and reflects the reality of the market behavior. But when after the N number of periods the outstanding value drops off, it again produces a co-measurable impact on the calculation of the indicator, which is less justified than in the case of its appearance. This can be considered as one of the drawbacks of the PPMA indicator.
Another drawback of the PPMA indicator is its inertia caused by the fact that all the Pivot Points are average values unable to react momentarily to sudden market price changes. In other words, the PPMA indicator always lags behind the market prices, reacts to the market price changes with a certain delay.
As all the other moving average indicators, the PPMA indicator uses the historical data for its calculation, and, as a result, reveals the market trend that has already developed and does not show the future trend. A trader can only suppose that the past trend will continue to develop in the same direction for some time in the future and make appropriate trading decisions.
To apply a PPMA indicator to a chart, a trader needs to follow the procedure common to all Marketscope indicators. For more information, see the Add Indicator article.