ON_BALANCE_REAL_VOLUME (On Balance Real Volume)
ON_BALANCE_REAL_VOLUME (On Balance Real Volume) is a volume oscillator. It was developed by FXCM for technical analysis in forex trading.
Note: In this article, instead of a lengthy oscillator's name, ON_BALANCE_REAL_VOLUME, we will use a shorter one, Real OBV.
Unlike a similar oscillator, OBV, that uses tick volume as its data, Real OBV allows to monitor an instrument's cumulative currency volume of all FXCM trades during a given period. It is
generally accepted that volume always foreruns and influences price changes. The greater the volume is, the greater the instrument's price changes, and the greater it changes, the stronger its trend is. Thus,
traders can see a price trend's presence and direction, evaluate its strength, and anticipate possible trend reversals and make informed trading decisions.
For these purposes, every period's volume, provided by the trading server together with the price data, is assessed as positive or negative depending on whether the period's closing price is higher (positive
volume) or lower (negative volume) than the closing price of the immediately preceding period. A positive volume is added to and a negative one is deducted from the cumulative volume of the preceding periods.
If the period's volume is neutral (stays unchanged), no action is taken. As a result, a running total of positive and negative values is obtained for each period. On a chart, Real OBV is drawn in the form of a
line moving up and down within the chart's area. The absolute value of Real OBV is not important, whereas, its line plays the major role in the oscillator's interpretation. The Real OBV line rises when positive
volumes prevail over negative ones and falls when negative volumes are stronger. A rising Real OBV reflects positive volume pressure that can lead to higher prices. Conversely, falling Real OBV reflects
negative volume pressure that can foreshadow lower prices. Thus, when the line goes up, it confirms an uptrend presence. Conversely, when the line goes down, a downtrend is confirmed. The line moving
horizontally for a noticeable period of time confirms a sideways market presence. The steeper the line is, the stronger the trend is. When divergences occur (read later), trend reversals can be expected.
As all oscillators, Real OBV is always drawn in an additional area below the market price chart.
On the following picture, you can see an example of Real OBV drawn in an additional area below the market price chart.
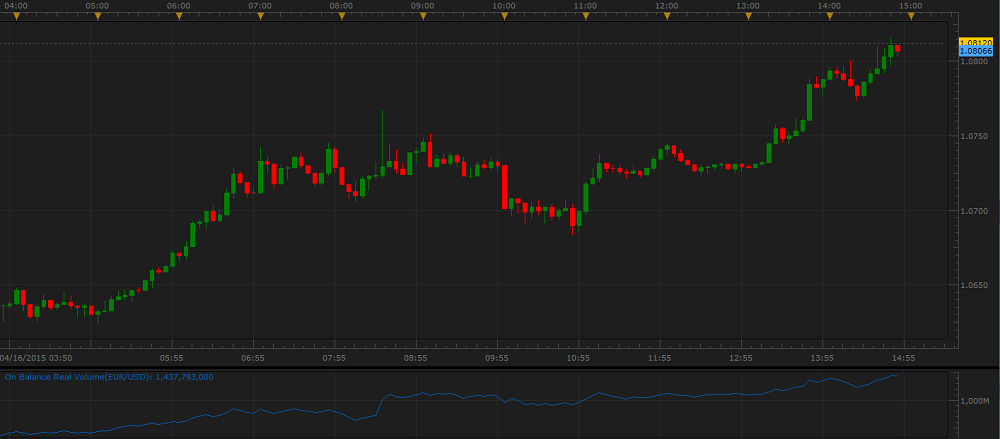
Please notice that Real OBV uses the volume data that belongs to the past. But we know that volume changes precede and influence price behavior. Thus, Real OBV is one of the few technical analysis tools that
can serve as a leading indicator foreshadowing price changes.
Real OBV is not often used as a stand-alone oscillator. It works best in conjunction with a market price chart and some other indicators as a confirmation or denial tool of their trading signals.
To apply a Real OBV oscillator to a chart, a trader needs to follow the procedure common to all Marketscope indicators. For more information,
see the Add Indicator article.
During the procedure, a trader can customize an indicator by specifying its parameters in the Properties dialog box. For more information, see the Change Indicator Properties
When a Real OBV oscillator is drawn on a chart, a trader can analyze its information and try to use it correctly. The oscillator produces its own trading signals, but they are generally used to confirm other
indicators' information:
- Trend Confirmation
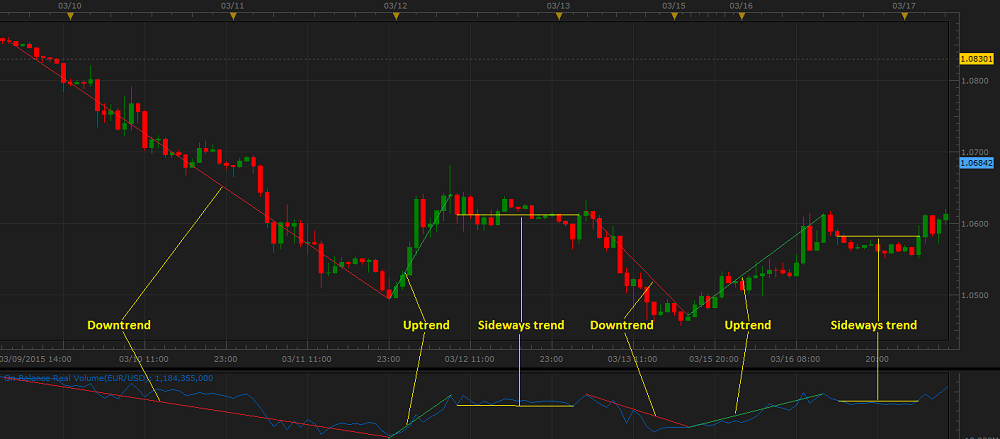
In the majority of cases, the Real OBV line's direction can be used to confirm a price trend presence and direction. When the Real OBV line moves step-for-step with an instrument's price, it confirms
the direction and strength of the instrument's price trend.
On the following picture, you can see examples of the oscillator's confirming different price trends.
- Trend Reversal Confirmation
To confirm an instrument's price trend reversal, look for a divergence. Divergences occur when the market price and the oscillator line move in the opposite directions (divergence itself) or towards
each other (often called convergence). Please remember that assessment of whether a period's volume is positive, negative, or neutral is based on closing prices, therefore closing prices should be
considered when looking for divergences.
Divergences are subdivided into the following two types:
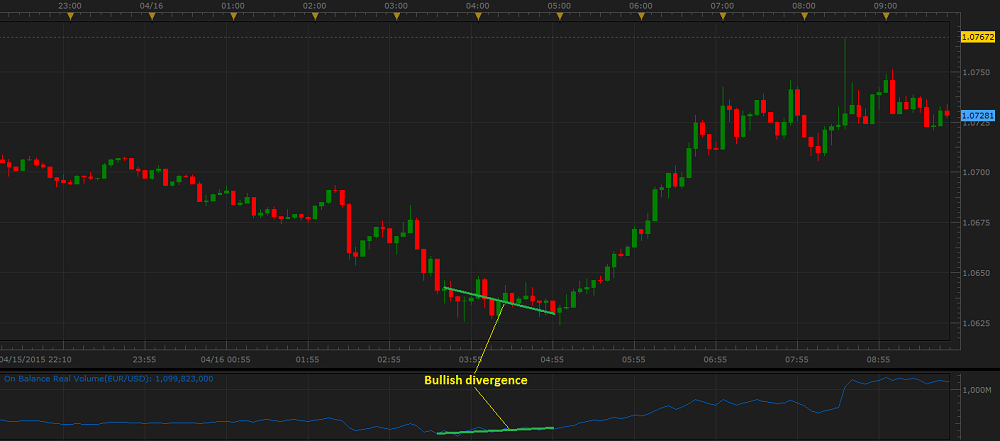
- Bullish divergence - occurs when an instrument's price moves down, but the Real OBV line moves up or flat. This indicates that though the instrument's price declines, the growing volume
pushes it up, and the price trend will sooner or later reverse and start to rise.
On the following picture, you can see an example of a bullish divergence.
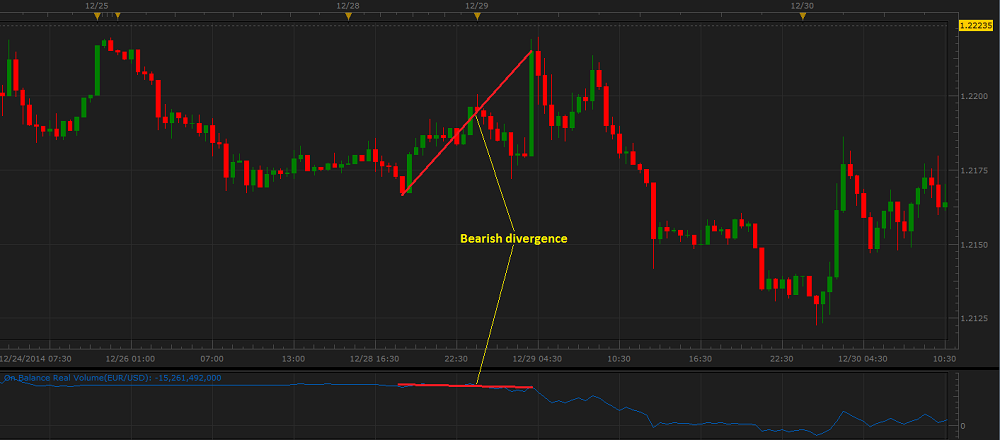
- Bearish divergence - occurs when an instrument's price moves up, but the Real OBV line moves down or flat. This indicates that though the instrument's price rises, it has not enough volume to sustain the growth, and the price trend will sooner or later reverse and start to decline.
On the following picture, you can see an example of a bearish divergence.
Please note that divergences are often misleading in a strong price trend: a bullish (or bearish) divergence can occur in a strong downtrend (or uptrend) and yet the strong downtrend (or uptrend) continues.
The Real OBV oscillator's values are calculated automatically using the following formulas:
If the current period's closing price is greater than that of the immediately preceding one (positive volume):
ROBVi = ROBVi-1 + CVi
If the current period's closing price is less than that of the immediately preceding one (negative volume):
ROBVi = ROBVi-1 - CVi
If the current period's closing price is equal to that of the immediately preceding one (neutral volume):
ROBVi = ROBVi-1
where:
ROBVi - is the Real OBV value of the current period.
ROBVi-1 - is the Real OBV value of the period immediately preceding the one being calculated.
CVi - is the currency volume of the current period.
back