SAR (Parabolic Time/Price System)
SAR (Parabolic Time/Price System, also referred to as Parabolic Stop and Reverse) is one of the most popular and widely used indicators. It was developed by J. Welles Wilder and introduced in his book
New Concepts in Technical Trading Systems in 1978.
According to W. Wilder, the indicator shows the market price trends and points of trend reversals. Besides, the way the indicator's prices are calculated allows to reduce the indicator lagging, which is so
typical of all trend-following indicators.
For SAR uptrend and downtrend values calculation, individual formulas are used (they are provided later in the article). Each period's price is calculated using an acceleration factor (AF). It works as
follows: initially, AF is set to a certain value (in Marketscope it is called Step, and by default it is 0.02). Then, in the process of calculation of all the following periods, AF can either
increase or remain unchanged. If during the period being calculated a new highest (on an uptrend) or lowest (on a downtrend) price is reached, AF increases. If no new highest (on an uptrend) or lowest (on a
downtrend) price is reached, AF remains unchanged. In the first case, AF increases by the value of the Step of 0.02 and becomes 0.04, 0.06, 0.08, etc., till it reaches a certain maximum value (in
Marketscope it is called Max and, by default, it is 0.2). Having reached the maximum value, AF stops increasing and its maximum value continues to be used in the calculation of all the following
periods.
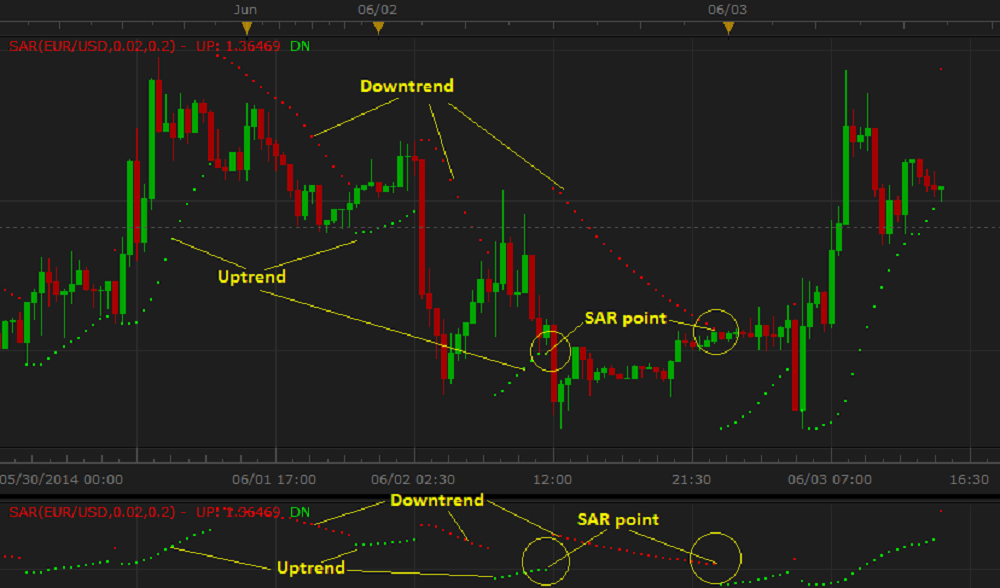
On a chart, SAR is drawn as a dotted line of a parabolic shape above (downtrend) or below (uptrend) the market price bars. With each step of AF increasing, the indicator becomes faster, and its dotted line
converges more and more to the current market price bars till it finally hits one of the prices (it can happen during the calculation of the first or any other following period). At this point a trend
reversal takes place. The trend starts moving in the opposite direction, and a new calculation cycle begins resulting in a new dotted line drawn on the other side of the market price bars. This point is
called the Stop and Reverse (SAR) point. The cycles repeat again and again, and the indicator stays on the chart permanently. Please note that the indicator can be drawn on the price chart or in an
additional area below it.
On the following picture you can see examples of SAR indicators drawn on the market price chart and in an additional area below it.
By employing the SAR indicator, a trader gets a crisp picture of the market behavior and can make informed trading decisions. It is also good to use a SAR indicator in combination with other indicators,
especially with the ADX indicator that measures a trend's strength.
As all the other technical analysis indicators, SAR works well only when certain factors influence the market. It is good on strong stable descending or ascending trends. Whereas in case of sideway market
price movements, the indicator produces false signals, and a trader should refrain from any trading activity or, if the trading skills and experience permit, use special techniques such as pip-hunting.
Besides, the SAR indicator uses the historical data for its calculation, and, as a result, it reveals the market trends and reversal points that have already developed or taken place. It does not show the
future events of the market behavior. A trader can only suppose that the past trend will continue to develop in the same direction for some time in the future and make appropriate trading decisions.
To apply a SAR indicator to a chart, a trader needs to follow the procedure common to all Marketscope indicators. For more information, see the Add Indicator article.
During the procedure, a trader can customize an indicator by specifying its parameters in the Properties dialog box. For more information, see the Change Indicator Properties
article.
The parameters fall into two groups:
- Calculation - the parameters needed to calculate an indicator's prices.
- Style and Appearance - the parameters needed to specify the way an indicator appears on a chart.
The SAR indicator has two Calculation parameters:
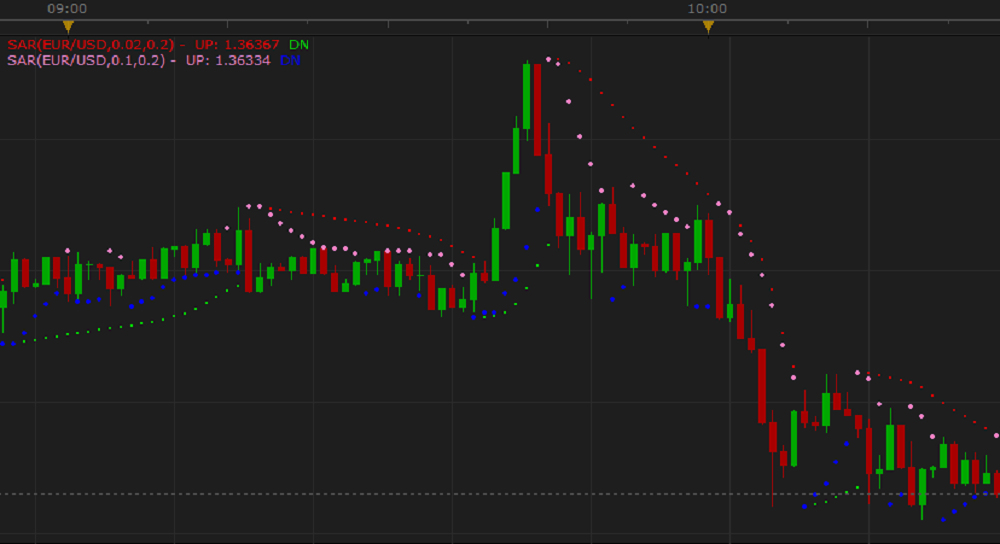
- Step - the parameter allows to specify the size of the increment of AF. The possible values are from 0.001 through 1.0. The default value is 0.02. The greater the number is, the faster
the indicator reacts to the market price changes producing smaller lagging. Its dotted line converges closer to the price bars, thus, more often it hits them and produces more SAR points. Traders
choose the parameter value in accordance with their trading tasks, strategies, and techniques. The commonly used value is the default one that is 0.02.
On the following picture, you can see how indicators with different Step parameter values look like on a chart. The pink and blue (0.1, 0.2) dotted lines of the SAR indicator react to the market price
changes faster and stay closer to the price bars, and produce more SAR points than its red and green (0.02, 0.2) lines:
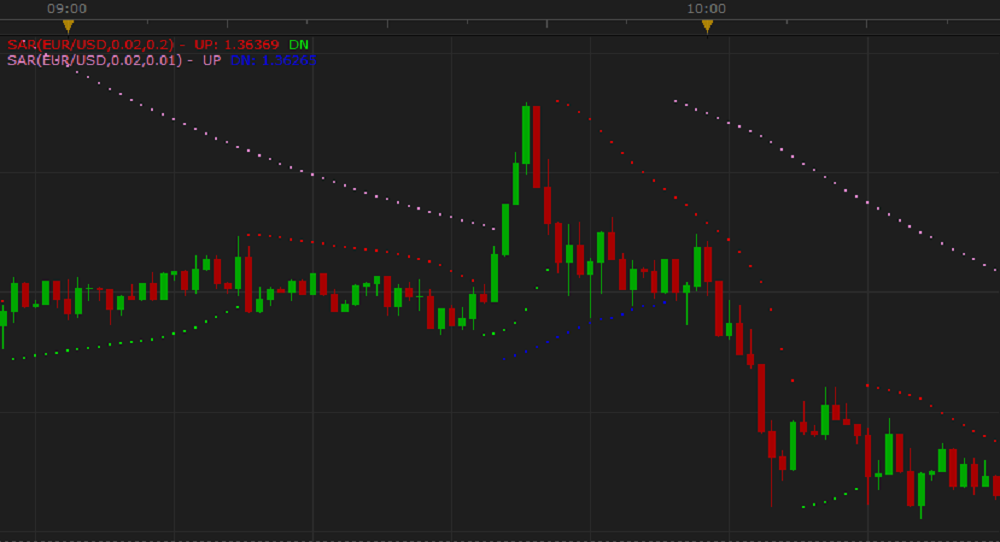
- Max - the parameter allows to specify the maximum size of AF. The possible values are from 0.001 through 10.0. The default value is 0.2. The smaller the number is, the faster AF stops
to increase, and the indicator stops to accelerate, thus, becoming slower and producing greater lagging. Its dotted line stays farther away from the price bars and hits them less often resulting in
less SAR points. Traders choose the parameter value in accordance with their trading tasks, strategies, and techniques. The commonly used value is the default one that is 0.2.
On the following picture, you can see how indicators with different Max parameter values look like on a chart. The pink and blue (0.02, 0.01) dotted lines of the SAR indicator react to the market
price changes slower, stay farther away from the price bars, and produce less SAR points than its red and green (0.02, 0.2) dotted lines:
The parameters are available on the Parameters tab of the SAR Parameters dialog box under the Calculation heading.
When a SAR indicator is drawn on a chart, a trader can analyze it and try to predict the market trend direction. But the key feature of SAR is its ability to signal trend reversals or, as we named them
earlier, SAR points. When a SAR point occurs, it is not clear how long a new trend will continue (sometimes it lasts only one period, and sometimes it lasts for a great number of periods). Thus, a SAR point
only warns of a possible trend reversal and the need to consider closing of Buy and opening of Sell positions on an uptrend or closing of Sell and opening of Buy positions on a
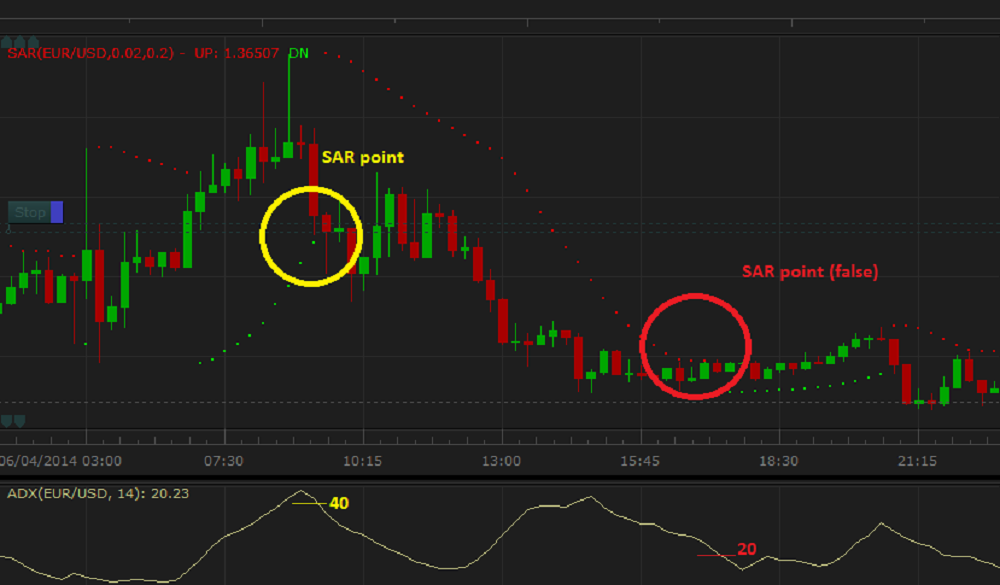
downtrend. To strengthen the signals, W. Wilder suggests that the SAR and ADX (Average Directional Index) indicators should be used together. ADX helps defining the presence and strength
of a trend.
The SAR signals are more accurate during a strong trend. When a trend is not present, the SAR signals are most likely to be false. W. Wilder suggests that a strong trend is present when ADX is above 25, and
no trend is present when it is below 20.
On the following picture, the yellow SAR point signal is supported by the high value of ADX (40) resulting in a strong downtrend. The signal is good. Whereas, the red SAR point signal is not supported by the
ADX value, which is only 20. As a result, the signal is false, and no strong trend follows.
The SAR indicator's values are calculated differently for uptrend and downtrend lines.
The uptrend line's formula:
SARi = SARi-1 + AFi-1(EPHi-1 - SARi-1)
where:
SARi - is the SAR value of the period being calculated.
SARi-1 - is the SAR value of the period immediately preceding the one being calculated.
AFi-1 - is the acceleration factor of the period immediately preceding the one being calculated.
EPHi-1 - is the highest price of the period immediately preceding the one being calculated.
The downtrend line's formula:
SARi = SARi-1 + AFi-1(EPLi-1 - SARvi-1)
where:
SARi - is the SAR value of the period being calculated.
SARi-1 - is the SAR value of the period immediately preceding the one being calculated.
AFi-1 - is the acceleration factor of the period immediately preceding the one being calculated.
EPLi-1 - is the lowest price of the period immediately preceding the one being calculated.
back