ADX (Average Directional Index)
ADX (Average Directional Index) is a popular and widely used oscillator. It was developed by Welles Wilder and introduced in his book New Concepts in Technical Trading Systems in 1978.
The ADX oscillator helps to determine presence or absence of a market price trend as well as its strength. It is very important to understand that the indicator's values can characterize trends of both
directions (up and down).
The values are calculated in a multi-step way (the mathematical formulas are provided later in the article). As a result, values in the range from 0 through 100 are obtained for each period.
On a chart, the ADX oscillator is drawn in the form of a line oscillating within this range (0 - 100) generating peaks and valleys or frequent low waves.
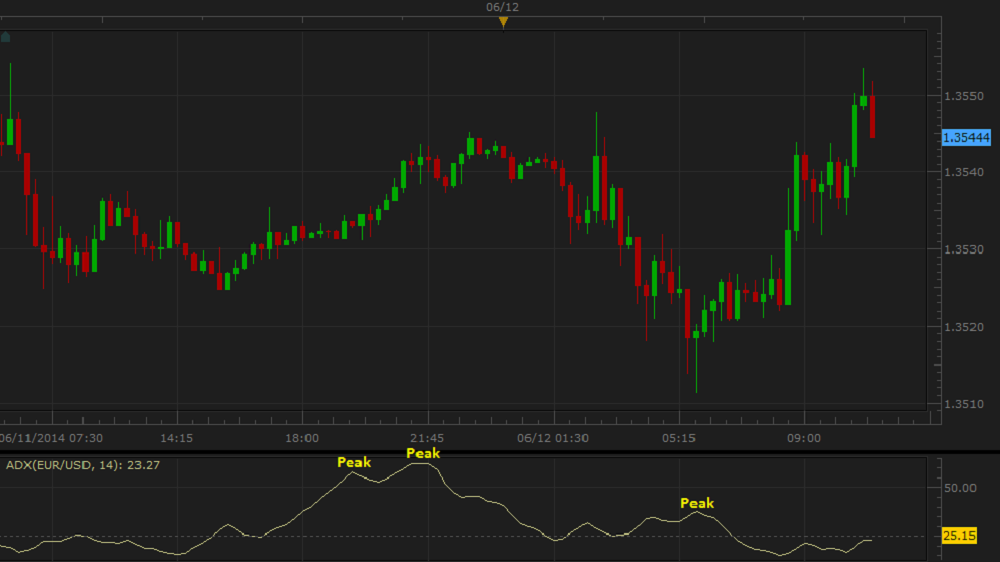
On the following picture, you can see an example of ADX drawn in an additional area below the chart.
Note: Some forex trading platforms offer charts where ADX is drawn together with the DMI oscillator in one area. DMI's lines correspond to Plus Directional Indicator (+DI) and
Minus Directional Indicator (-DI) and help to determine presence or absence of a market trend. In Marketscope you can open a DMI oscillator in an additional area below the ADX chart.
By employing the ADX oscillator, a trader gets a picture of the market trend's behavior (its presence or absence and strength) and can use the information for making informed trading decisions.
The ADX oscillator works well in combination with other indicators, such as SAR or DMI.
Its data is reliable only on steady strong trends. When the market is volatile and moves sideways, ADX produces frequent waves or flat stretches that are useless, and a trader should refrain from any trading
activity or, if the trading skills and experience permit, use other technical analyses tools.
Note also that during the steps of its calculation, several smoothing techniques are applied resulting in a fair amount of the oscillator's lagging.
Besides, the ADX oscillator uses the historical data for its calculation and reveals the market trend's
characteristics that have already developed. ADX does not show the future trend's behavior. A trader can
only suppose that the past behavior and characteristics will continue to develop in the same way for some
time in the future and try to use them appropriately.
To apply an ADX oscillator to a chart, a trader needs to follow the procedure common to all Marketscope
indicators. For more information, see the Add Indicator article.
During the procedure, a trader can customize the oscillator by specifying its parameters in the Properties dialog box. For more information, see the Change Indicator Properties
article.
The parameters fall into two groups:
- Calculation - the parameters needed to calculate an oscillator's prices.
- Style and Appearance - the parameters needed to specify the way an oscillator appears on a chart.
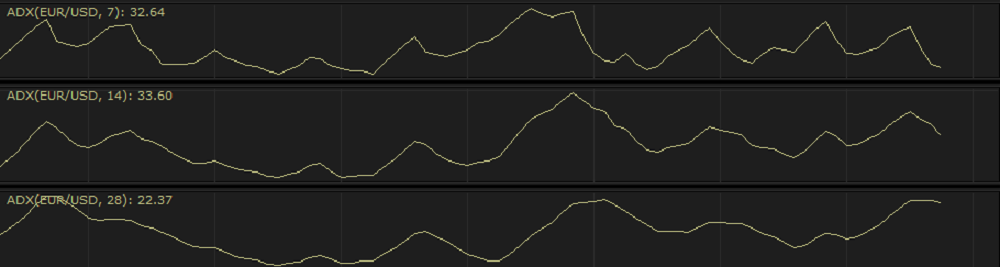
The ADX oscillator has only one Calculation parameter - Number of periods. The parameter allows specifying the number of periods, over which the oscillator is to be calculated. The possible values
are from 2 through 1,000. The default value is 14. The smaller the number is, the more sensitive the oscillator becomes, and the faster it reacts to the market price changes producing less lagging. The greater
the number is, the less sensitive the oscillator becomes, and the slower it reacts to the market price changes producing greater lagging behind the market prices. Traders choose the Number of periods parameter's
value in accordance with their need of the level of sensitivity of the oscillator. The recommended (Wilder's default) and most commonly used value is 14.
On the following picture, you can see how oscillators of different Number of periods parameter values look like on a chart.
The parameter is available on the Parameters tab of the ADX Properties dialog box under the Calculation heading.
When an ADX oscillator is drawn on a chart, a trader can analyze its behavior and try to interpret it correctly. As it is, ADX produces no trading signals. As you already know, it only helps detecting presence
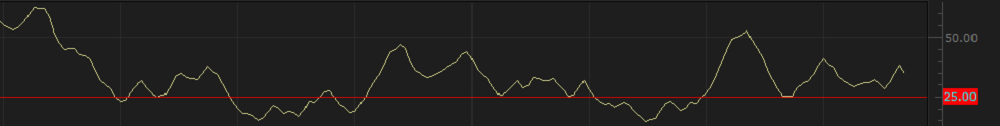
or absence of the market trend and evaluating its strength. W. Wilder suggests that a strong trend is present when ADX is above 25, and no trend is present when it is below 20. There appears to be a gray zone
between 20 and 25. It is up to a trader to select the level within this area. Many traders use 20 as the key level for ADX. Once you decide on the value of your threshold level, you can draw a horizontal line
to keep it visible on the chart permanently.
On the following picture, you can see an example of the ADX oscillator with a horizontal line on the level of 25.
Some technical analysts suggest that traders pay attention to the oscillator's line direction: when it starts climbing up, an appearance of a trend is anticipated, and the steeper the line is, the stronger
the trend is going to be; when the line starts climbing down, the trend is anticipated to weaken, and the steeper the line is, the faster the trend weakens. Thus, the steeper the lines are, the more predictive
ADX is.
When ADX is above 35, and the line takes the form of a peak, it can be considered as a warning of a trend reversal. In such situations, it is good to use a very sensitive indicator, such as SAR,
to confirm the possibility of a trend reversal.
The ADX oscillator's values are calculated automatically using the following formula:
ADXi = EMAi x ( |DMI(+) - DMI(-)| / (DMI(+) + DMI(-)) x 100
where:
ADXi is the Average Directional Index value of the period being calculated.
EMAi is the Exponential Moving Average value of the period being calculated. For more information, see the EMA Indicator article.
DMI(+) is the positive Directional Movement Index value of the period being calculated. For more information, see the DMI Indicator article.
DMI(-) is the negative Directional Movement Index value of the period being calculated.
back