ZIGZAG (ZigZag)
ZIGZAG (ZigZag) is one of the most popular and widely used indicators of Marketscope.
ZIGZAG is considered to be a trend-following indicator as it smooths the market noises and shows price trends more clearly. But the majority of traders use it as an auxiliary tool that helps
identifying common chart figures, such as Head and Shoulders, Elliott Waves, and support and resistance levels, to name a few. For this purpose, the indicator singles out price bar successions of upward or
downward direction, identifies their highest and lowest values, and connects them with a line. The process is automatic and requires satisfying the requirements of certain setting parameters (read later in
the article). As a result, on the market price chart, a broken line with segments of alternating colors is drawn.
Note that the indicator can also be drawn in an additional area below the market price chart.
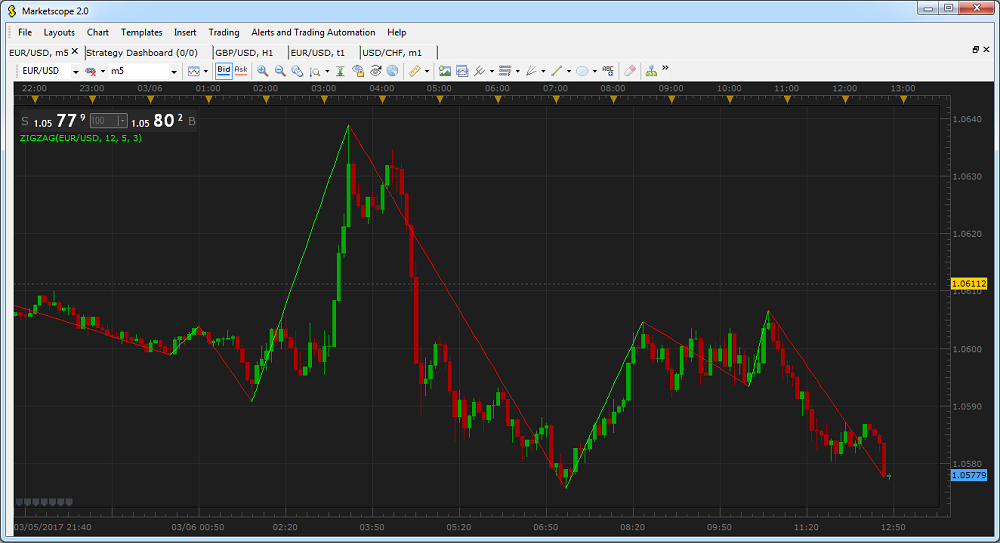
On the following picture, you can see an example of ZIGZAG drawn on the market price chart.
To apply a ZIGZAG indicator to a chart, a trader needs to follow the procedure common to all Marketscope indicators. For more information, see the Add Indicator article.
During the procedure, a trader can customize an indicator by specifying its parameters in the Properties dialog box. For more information, see the Change Indicator Properties
article.
The parameters fall into two groups:
- Calculation - the parameters needed to calculate an indicator's prices.
- Style and Appearance - the parameters needed to specify the way an indicator appears on a chart.
The ZIGZAG indicator has three Calculation parameters:
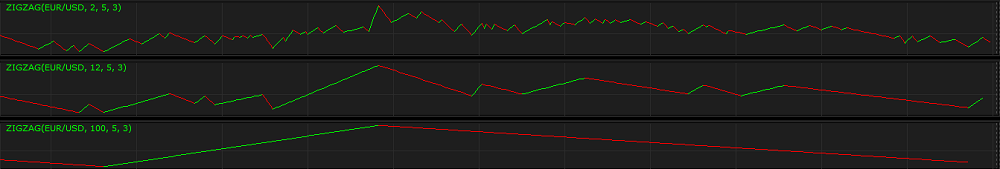
- Depth - the parameter allows to specify the minimum number of periods, needed to draw one segment of the indicator's line. The possible values are from 1 through 10,000. The default value is 12. The smaller the number is, the shorter the segments are and the line changes its direction more often. The greater the number is, the longer the segments are, and the line changes its direction less frequently. A trader chooses the Depth parameter's value in accordance with what chart figures need to be identified. For identifying Elliott Waves, for example, the commonly used value is the default one - 12.
On the following picture, you can see examples of ZIGZAG indicators with different Depth parameter's values (2, 12, 100) drawn in additional areas.
- Deviation - the parameter allows to specify the minimum number of pips by which the new period's extreme value must differ from the one of the previous period to be assessed as the highest or lowest of all the values of the line's segment and cause the ZIGZAG line. The possible values are from 1 through 1,000. The default value is 5. A trader chooses the Backstep parameter's value in accordance with what chart figures need to be identified. For identifying Elliott Waves, for example, the commonly used value is the default one - 5.
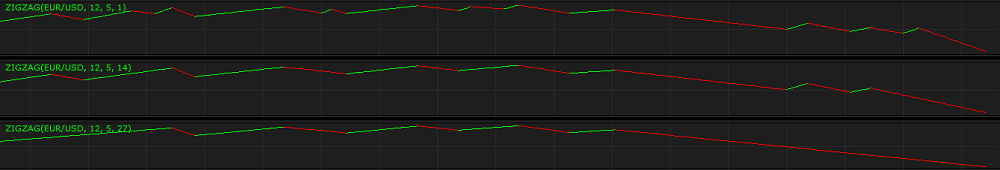
- Backstep - the parameter allows to specify the number of bars backwards from the current bar to be used for an assessment triggered by reaching or surpassing the Deviation parameter's value. The possible values are from 1 through 10,000. The default value is 3. The smaller the number is, the shorter the segments are and the line changes its direction more often. The greater the number is, the longer the segments are, and the line changes its direction less frequently. A trader chooses the Backstep parameter's value in accordance with what chart figures need to be identified. For identifying Elliott Waves, for example, the commonly used value is the default one - 3.
On the following picture, you can see examples of ZIGZAG indicators with different Backstep parameter's values (1, 14, 27) drawn in additional areas.
The parameter is available on the Parameters tab of the ZIGZAG Properties dialog box under the Calculation heading.
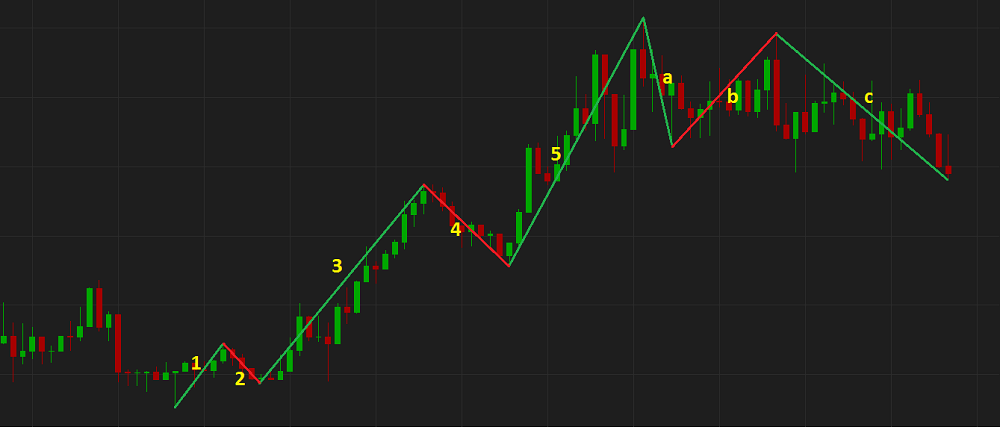
When a ZIGZAG indicator is drawn, a trader can use its line's shape in identifying certain chart figures.
On the following picture, you can see an Elliot Waves pattern identified with the help of the ZIGZAG indicator.
The ZIGZAG indicator's values are calculated automatically and presented on a chart as a broken line.
back