DMI (Directional Movement Index)
DMI (Directional Movement Index) is a popular and widely used oscillator. It was developed by Welles Wilder and introduced in his book New Concepts
in Technical Trading Systems in 1978.
The DMI oscillator helps determining a market trend direction.
The values are calculated in a multi-step way (the mathematical formulas are
provided later in the article). As a result, values in the range from 0 through 100 are obtained for Plus Directional Indicator (in Marketscope,
called DI+) and Minus Directional Indicator (in Marketscope, called DI-) of every period.
On a chart, the DMI oscillator is drawn in the
form of two lines oscillating within this range (0 - 100) in an additional area below the chart. The position of the two lines in respect to each
other determines the direction of the market price trends: when the DI+ line is above the DI- line, the trend is up; when the DI- line is above the
DI+ line, the trend is down. The wider the spread between the lines is, the more evident the trend is. The point of crossing of the lines may
indicate a trend reversal. Frequent crisscrossing of the lines indicates a ranging market.
On the following picture, you can see an example of the DMI oscillator drawn in an additional area below the chart.
Note: Some Forex trading platforms offer charts where DMI is drawn together with the ADX oscillator in one area. The ADX line helps to
determine presence or absence of a market trend.
By employing the DMI oscillator, a trader gets a picture of the market trend's behavior: the lines of the Plus and Minus Directional Indicators
interact and provide the information for making trading decisions.
The DMI oscillator works well in combination with other indicators, such as ADX. But its data is reliable only on steady strong trends. When
the market is volatile and moves sideways, DMI produces frequent crisscrosses of its lines that are useless, and a trader should refrain from any
trading activity or, if the trading skills and experience permit, use other technical analysis tools.
Note also that during the steps of its calculation, several smoothing techniques are applied resulting in a fair amount of the oscillator's lagging.
Besides, the DMI oscillator uses the historical data for its calculation and reveals the market trend's directions that have already developed.
DMI does not show the future trend's behavior. A trader can only suppose that the past trend will continue to develop in the same direction for some
time in the future and try to act in accordance with this supposition.
To apply a DMI oscillator to a chart, a trader needs to follow the procedure common to all Marketscope indicators. For more information, see
the Add Indicator article.
During the procedure, a trader can customize an oscillator by specifying its parameters in the Properties dialog box. For more information, see the
Change Indicator Properties
article.
The parameters fall into two groups:
- Calculation - the parameters needed to calculate an indicator's prices.
- Style and Appearance - the parameters needed to specify the way an indicator appears on a chart.
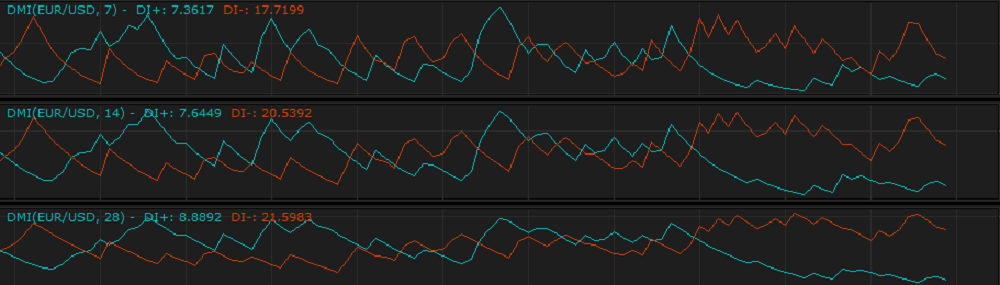
The DMI oscillator has only one Calculation parameter - Number of periods. The parameter allows specifying the number of periods,
over which the oscillator is to be calculated. The possible values are from 1 through 1,000. The default value is 14. The smaller the
number is, the more sensitive the oscillator becomes, and the faster it reacts to the market price changes producing less lagging. Its lines
obtain greater amplitudes, thus, crisscrossing each other more often and producing more false signals. The greater the number is, the less sensitive
the oscillator becomes, and the slower it reacts to the market price changes producing greater lagging behind the market prices. Its lines obtain
smaller amplitudes, thus, crisscrossing each other less often providing the risk of missing more good signals. Traders choose the Number of periods parameter's value in accordance with their need of
the level of sensitivity of the oscillator. The recommended (Wilder's default) and most commonly used value is 14.
On the following picture, you can see how oscillators of different Number of periods parameter's values look like on a chart.
The parameter is available on the Parameters tab of the DMI Properties dialog box under the Calculation heading.
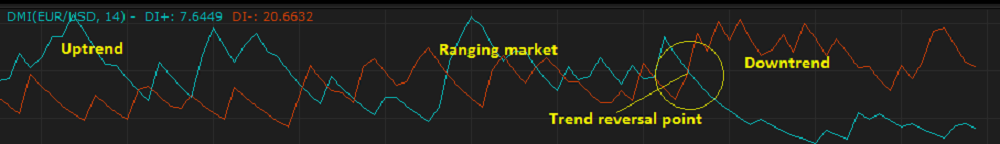
When a DMI oscillator is drawn on a chart, a trader can analyze its behavior and try to interpret it correctly. DMI is used to determine a market
price trend's reversal points and its direction. The trading signals are:
- The crossing of the Plus Directional Indicator's line by the Minus Directional Indicator's line from below can be a warning of a possible
trend reversal downwards and the need to consider closing of Buy and opening of Sell positions.
- The crossing of the Minus Directional Indicator's line by the Plus Directional Indicator's line from below can be a warning of a possible
trend reversal upwards and the need to consider closing of Sell and opening of Buy positions.
- The location of the Plus Directional Indicator's line above the Minus Directional Indicator's line is a signal of a prevailing uptrend.
The more away from each other the lines are, the stronger the trend is.
- The location of the Minus Directional Indicator's line above the Plus Directional Indicator's line is a signal of a prevailing downtrend.
The more away from each other the lines are, the stronger the trend is.
- Frequent crisscrossing of the Plus and Minus Directional Indicators' lines signals a ranging market.
Note: To strengthen the signals, it is worth using the DMI and ADX oscillators together. ADX helps defining
presence or absence of a trend and, in the case of a trend presence, its strength. Another very sensitive indicator that can be used
together with DMI is SAR (Parabolic Time/Price System), also referred to as Parabolic Stop and Reverse that confirms a
possibility of a trend reversal.
On the following picture, you can see the trading signals mentioned earlier.

The DMI oscillator's values are calculated separately for uptrend (DI+) and downtrend (DI-) lines using the following formulas:
DI+i = EMAi x (+DMi / ATRi) x 100
where:
DI+i - is the Plus Directional Indicator value of the period being calculated.
EMAi - is the EMA Indicator value of of the period being calculated.
+DM - is the Plus Directional Movement value.
ATRi - is the ATR Oscillator value of the period being calculated.
+DM = UpMove if UpMove > DownMove and UpMove > 0, else +DM = 0.
UpMove = Highi - Highi-1
where:
Highi - is the highest price of the period being calculated.
Highi-1 - is the highest price of the period immediately preceding the one being calculated.
DownMove = Lowi - Lowi-1
where:
Lowi - is the lowest price of the period being calculated.
Lowi-1 - is the lowest price of the period immediately preceding the one being calculated.
DI-i = EMAi x (-DMi / ATRi) x 100
where:
DI-i - is the Minus Directional Indicator value of the period being calculated.
-DM - is the Minus Directional Movement value.
-DM = DownMove if DownMove > UpMove and DownMove > 0, else -DM = 0.
back