KAMA (Kaufman's Adaptive Moving Average)
KAMA (Kaufman's Adaptive Moving Average) is another popular and widely used moving average indicator. It was developed by Perry J. Kaufman as an
attempt to further improve the performance of moving average indicators. Kaufman's Adaptive Moving Average began taking form in 1972 and finally
was presented in 1998 in his book Trading Systems and Methods, 3-rd Edition.
As all other moving average indicators, the KAMA indicator smooths the market noises and shows the market trends more clearly.
To achieve the goals, the indicator filters out the market fluctuations (noises) by averaging the price values of the periods, over which it is calculated. In the process, some extra value (weight) is added
to the average prices, as it is done during
calculations of all weighted indicators, such as EMA, LWMA, and SMMA. But during the KAMA indicator's calculation, every particular price receives a
different weight increment adapted to the current market volatility. When the market prices are steadily moving in a certain direction, when there is a trend, the indicator becomes more sensitive and adds a
heavier weight increment to the price being calculated. When the price movement is volatile, the indicator becomes less sensitive and adds lighter weight increment to the price. The speed of the indicator
reaction adapts to the level of the market volatility. In other words, the indicator performs better when there is a steady trend. It reacts to the trend appearance and changes faster. On the other hand, when
the price movement is sideways, volatile, it reacts to the market fluctuations less actively producing less erroneous signals.
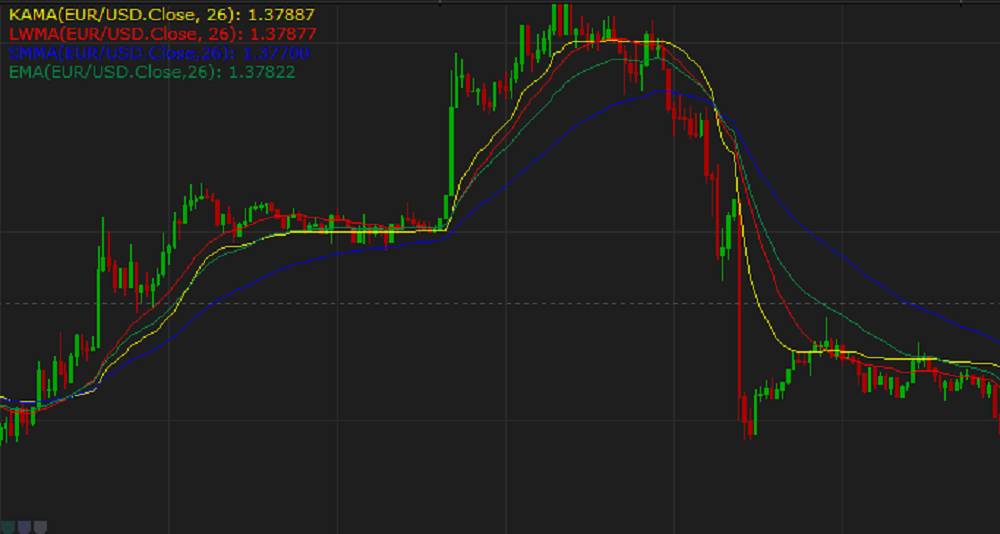
On the following picture, the yellow line of the KAMA indicator of 26 periods reacts faster to a trend behavior and remains more indifferent
to the market volatility compared to the lines of the other moving average indicators of the same number of periods.
By employing the KAMA indicator, a trader gets a crisp picture of the market behavior and can make informed trading decisions. It is also good to use
the indicator in combination with another KAMA indicator of a different period length or other than KAMA indicators.
Because the KAMA indicator uses the historical data for its calculation, it reveals the market trend that has already developed and does not show the
future trend. A trader can only suppose that the past trend will continue to develop in the same direction for some time in the future and make
appropriate trading decisions.
To apply a KAMA indicator to a chart, a trader needs to follow the procedure common to all Marketscope indicators. For more information,
see the Add Indicator article.
During the procedure, a trader can customize an indicator by specifying its parameters in the Properties dialog box. For more information, see the Change Indicator Properties
article.
The parameters fall into two groups:
- Calculation - the parameters needed to calculate an indicator's prices.
- Style and Appearance - the parameters needed to specify the way an indicator appears on a chart.
The KAMA indicator has only one Calculation parameter - Number of periods. The parameter allows specifying the number of periods, over which the
indicator is to be calculated. The possible values are from 2 through 1,000. The default value is 14. The smaller the number is, the less market noises the indicator filters, and the faster it reacts
to the market price changes. Its line stays closer to the price bars, thus, following the shorter-term market trends and producing less lagging. The greater the number is, the more market noises the indicator
filters, and the slower it reacts to the price changes. Its line stays more away from the market price bars, thus, following the longer-term market trends and producing greater lagging behind the market prices.
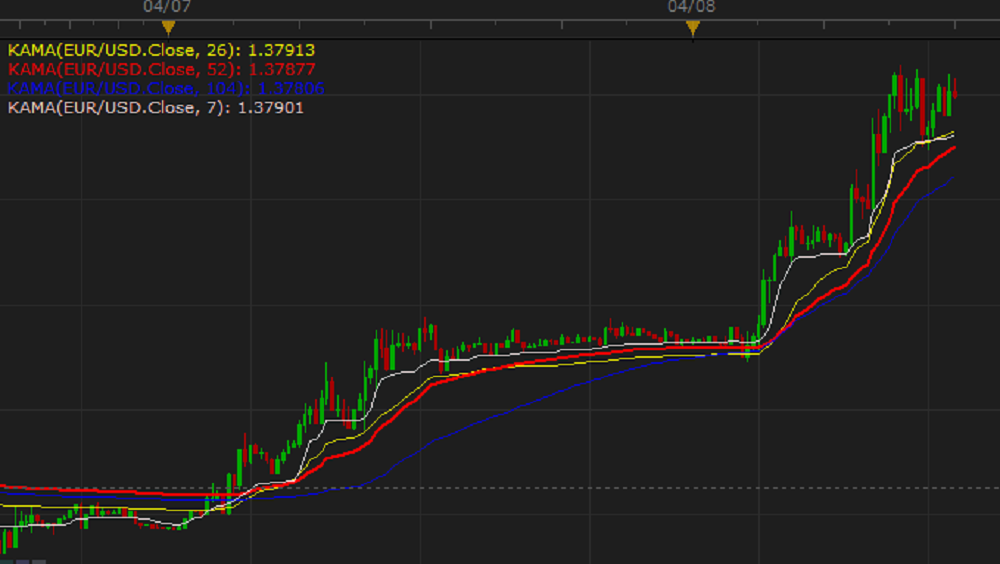
A trader chooses the Number of periods parameter value in accordance with his or hers trading tasks, strategies, and techniques. The commonly used values are 7, 14, 26, and 52.
On the following picture, you can see how indicators with different Number of periods parameters look like on a chart.
The parameter is available on the Parameters tab of the KAMA Properties dialog box under the Calculation heading.
When a KAMA indicator is drawn on a chart, a trader can analyze its behavior and try to predict the beginning of a new market trend or ending of an
old one. In other words, determine trend reversal points that can serve as signals for the actions that are similar to those of the MVA indicator.
The KAMA indicator's values are calculated automatically using the following formula:
KAMAi = KAMAi-1 + SCi x (Price - KAMAi-1)
where:
KAMAi - is the value of the period being calculated.
KAMAi-1 - is the value of the period immediately preceding the period being calculated.
Price - is the source (Close or other) price of the period being calculated.
sci - is the smoothing constant calculated for each period by using the following formula:
sci = [ERi x (fastest - slowest) + slowest]2
where:
fastest = 2 / (fastest moving average period + 1)
slowest = 2 / (slowest moving average period + 1)
ERi = |Pricei - Pricei-n+1| / Sum
where:
Sum = | Pricei - Pricei-1| + |Pricei-1 - Pricei-2| + ... + |Pricei-n+1 - Pricei-n|
back