SSD (Stochastic Slow)
SSD (Stochastic Slow) is one of three very popular and widely used Stochastic oscillators that were developed by George C. Lane in the late 1950s.
Besides SSD, the group includes SFK (Stochastic Fast) and STOCHASTIC (Stochastic). What makes SSD
'slow' is an additional smoothing technique used in its calculation (such smoothing technique is not used in the calculation of 'fast' SFK.
According to George C. Lane, Stochastic is a momentum oscillator that doesn't follow price, it doesn't follow volume or anything like that.
It follows the speed or the momentum of price. As a rule, the momentum changes direction before price. Hence, it can be added that Stochastic
oscillators help to foresee possible trend reversals, too.
A Stochastic oscillator consists of two sets of values:
- %K - compares the closing price of the period, the value of which is being calculated, to the high-low trading range over a
specified number of periods. In other words, it measures the level of the closing price of the period relative to the high-low
range over a given period of time. Assume that the highest price over a certain number of periods equals 110, the lowest one equals
100, and the closing price of the period being calculated equals 108. The high-low range is 10, which is the denominator in the %K
formula. The closing price less the lowest price equals 8, which is the numerator. 8 divided by 10 equals .80 (or 80%). Multiply
this number by 100 and then use the MVA smoothing technique to find %K.
- %D - is a signal line, which values are calculated by smoothing of %K.
The oscillator is calculated automatically in accordance with certain mathematical formulas (they are provided later in the article). As a
result, values of both lines in the range from 0 through 100 are obtained for each period. On a chart, the SSD oscillator is drawn in the form
of two lines moving up and down parallel to each other within this range (0 - 100). From time to time, they cross over certain fixed levels and
each other. The levels serve determining whether an instrument is overbought or oversold. The lines' crisscrossing can be a trading signal (read
later in the article).
A Stochastic oscillator is always drawn in an additional area below the market price chart.
On the following picture, you can see an example of the SSD oscillator drawn in an additional area below the price chart.
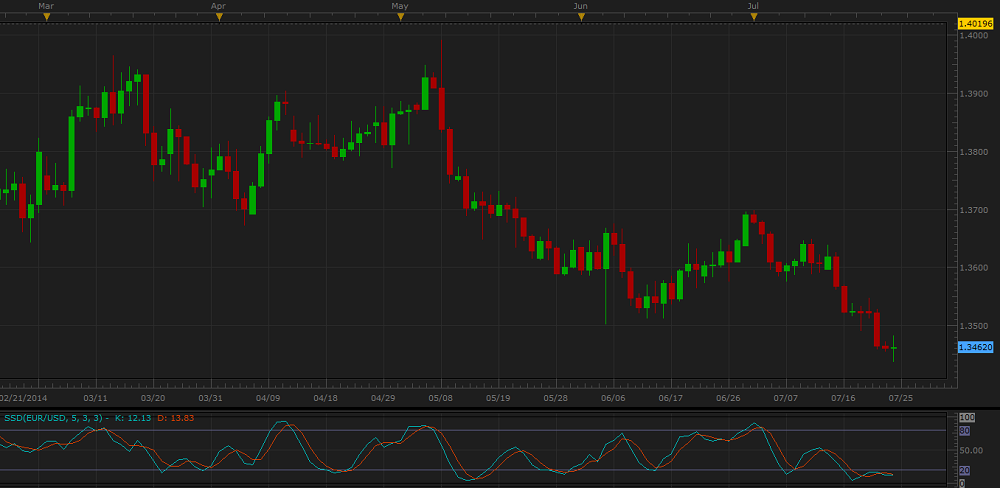
Please remember that the oscillator uses the historical data for its calculation, and all the information it provides belongs to the past.
Indicators do not predict the market price future behavior. A trader can only suppose that the past tendencies will continue to develop in the
same way for some time in the future and try to use this supposition appropriately.
As a momentum oscillator, SSD suits both ranging and trending markets, provided the trend takes on a zigzag format.
In calculation of the signal %D line, the oscillator employs an additional smoothing technique resulting in its noticeable lagging
behind the %K line.
The SSD oscillator works well in company with a bar chart and other indicators, especially trend-following ones.
To apply an SSD oscillator to a chart, a trader needs to follow the procedure common to all Marketscope indicators. For more information,
see the Add Indicator article.
During the procedure, a trader can customize the oscillator by specifying its parameters in the Properties dialog box. For more
information, see the Change Indicator Properties article.
The parameters fall into three groups:
- Calculation - the parameters needed to calculate an indicator's prices.
- Style and Appearance - the parameters needed to specify the way an indicator appears on a chart.
- Levels - the parameters needed to specify the values of overbought and oversold level lines.
The SSD oscillator has three Calculation parameters:
- %K periods - the parameter allows selecting the number of periods, over which the %K line is to be calculated.
Please note that as the %K line's values are used for calculation of the %D line's ones, the parameter's modification
affects the shape of the %D line as well. The possible values are from 2 through 1,000. The default value is 5.
The smaller the number is, the more sensitive the oscillator becomes. Its %K and %D lines produce more choppy waves
and cross the Overbought and Oversold level lines more often resulting in more frequent trading signals.
The greater the number is, the less sensitive the oscillator becomes.
Its %K and %D lines are smoother and cross the Overbought and Oversold level lines less often producing fewer
trading signals. Traders choose the %K periods parameter's value in accordance with their need of the level of sensitivity
of the oscillator. The recommended and most commonly used values are in the range from 5 through 10 when the oscillator
is used together with some other indicators or 14 and 21 when it is used alone.
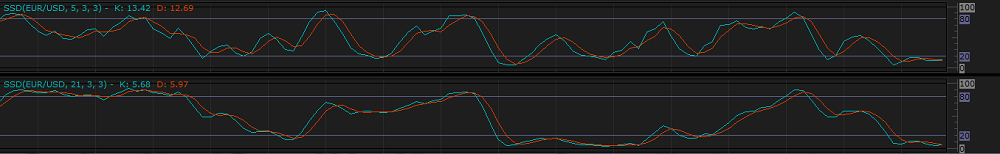
On the following picture, you can see examples of SSD oscillators with different %K periods parameter's values (5 and 21).
- %D slowing periods - the parameter allows selecting the number of periods of the smoothing technique (in Marketscope,
it is MVA) used in calculation of the %K and %D lines. The possible values are from 2 through 1,000. The default
value is 3. The smaller the number is, the more sensitive the oscillator becomes. Its %K and %D lines react
to the changes of the market price momentum faster, produce more choppy waves, and cross the Overbought and Oversold level
lines more often resulting in more frequent signals. The greater the number is, the less sensitive the oscillator becomes. Its %K
and %D lines are smoother, react to the changes of the market price momentum slower, and cross the Overbought
and Oversold level lines less often producing fewer trading signals. Traders choose the %D slowing periods parameter's
value in accordance with their need of the level of sensitivity of the oscillator. The recommended and most commonly used value
is 3 when the oscillator is used together with some other indicators or 5 when it is used alone.
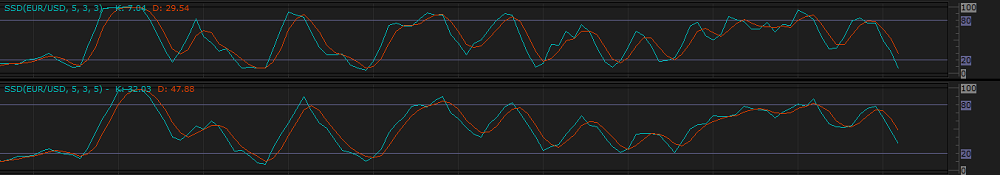
On the following picture, you can see examples of the SSD oscillators with different %D slowing periods parameter's
values (3 and 5).
- %D periods - the parameter allows selecting the number of periods, over which the smoothing technique of the %D line
is to be calculated (in Marketscope, it is MVA) when applied to the %K line's values. Please note that the parameter does not affect
the %K line and its shape remains intact when the %D periods' parameter changes. It smoothens the %D line causing its
lagging behind the %K line. The possible values are from 2 through 1,000. The default value is 3. The smaller the number is,
the more sensitive the oscillator's %D line becomes. It produces more choppy waves, stays closer to the %K line, and crosses
the Overbought and Oversold level lines more often resulting in more frequent trading signals. The greater the number is,
the less sensitive the oscillator's %D line becomes. It is smoother, stays more away from the %K line, and crosses
the Overbought and Oversold level lines less often resulting in fewer trading signals. Traders choose the %D periods
parameter's value in accordance with their need of the level of sensitivity of the oscillator's %D line. The recommended and
most commonly used value is 3 when the oscillator is used together with other indicators or 5 when it is used alone.
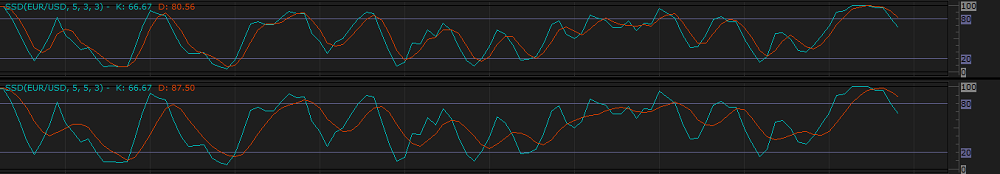
On the following picture, you can see examples of the SSD oscillators with different %D periods parameter's values (3 and 5).
The parameters are available on the Parameters tab of the SSD Properties dialog box under the Calculation heading.
The SSD oscillator has several Levels' parameters:
- Overbought level - the parameter allows selecting the threshold, at which an instrument can be considered to be overbought.
The possible values are from 0 through 100. The default value is 80. Traders choose the parameter's values in accordance with their
need of the level of the threshold. The recommended and most commonly used value is the default one - 80.
- Oversold level - the parameter allows selecting the threshold, at which an instrument can be considered to be oversold. The
possible values are from 0 through 100. The default value is 20. Traders choose the parameter's values in accordance with their
need of the level of the threshold. The recommended and most commonly used value is the default one - 20.
- Line levels width - the parameter allows selecting the widths of the Overbought and Oversold level lines, and it
works as the Lines width parameter listed under the Style heading on the Parameters tab of the Properties dialog box.
For more information, see the Change Indicator Properties article.
- Line levels style[ - the parameter allows selecting the styles of the Overbought and Oversold level lines, and it
works as the Lines style parameter listed under the Style heading on the Parameters tab of the Properties dialog box.
For more information, see the Change Indicator Properties article.
- Line levels color - the parameter allows selecting the colors of the Overbought and Oversold level lines, and it
works as the Lines color parameter listed under the Style heading on the Parameters tab of the Properties dialog box.
For more information, see the Change Indicator Properties article.
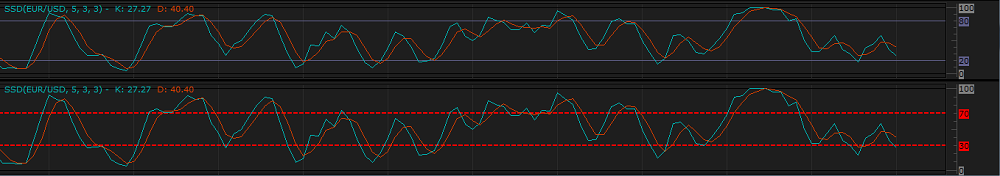
On the following picture, you can see how oscillators of different Levels' parameters (with level lines of different Overbought level
and Oversold level values, widths, styles, and colors) look like on a chart.
The parameters are available on the Parameters tab of the SSD Properties dialog box under the Levels heading.
When an SSD oscillator is drawn on a chart, a trader can analyze its information and try to interpret it correctly. SSD produces several trading
signals that are identical to those of the STOCHASTIC oscillator. For more information, see the STOCHASTIC Oscillator article.
The SSD oscillator's values are calculated automatically using the following formulas:
%Ki = K-period MA of 100 x (Sum of Closei - LowestN) / (Sum of HighestN - LowestN)
Sum of Closei - LowestN = (Closei - Lowesti) + (Closei-1 - Lowesti-1) + ... +
(Closei-N+1 - Lowesti-N+1)
Sum of HighestN - LowestN) = (Highesti - Lowesti) + (Highesti-1 - Lowesti-1) + ... +
(Highesti-N+1 - Lowesti-N+1)
where:
%Ki - is the oscillator's %K line value of the period being calculated.
K-period - is the number of periods (specified by the %K periods parameter), over which MA is calculated.
MA - is the MVA indicator.
N - is the number of periods, over which the %K line value is calculated (specified by the %D slowing periods parameter).
Closei - is the closing price value of the period being calculated.
LowestN - is the lowest value of the N-period time frame.
HighestN - is the highest value of the N-period time frame.
%Di = D-period MA of %Ki
where:
%Di - is the oscillator's signal %D line value of the period being calculated.
D-period - is the number of periods (specified by the Number of periods for %D parameter), over which MA is calculated.
MA - is the MVA indicator.
%Ki - is the oscillator's %K line value of the period being calculated.
back