STOCHASTIC (Stochastic)
STOCHASTIC (Stochastic) is one of three very popular and widely used Stochastic oscillators that were developed by George C. Lane in the late 1950s. Besides STOCHASTIC, the group includes
SFK (Stochastic Fast) and SSD (Stochastic Slow). STOCHASTIC is the most customizable oscillator of the three. Besides, in its calculation, STOCHASTIC (as well as SSD) uses
an additional smoothing technique as compared to SFK.
According to George C. Lane, STOCHASTIC is a momentum oscillator that doesn't follow price, it doesn't follow volume or anything like that. It follows the speed or the momentum of price. As a rule, the
momentum changes direction before price. Hence, it can be added that Stochastic oscillators help to foresee possible trend reversals, too.
A Stochastic oscillator consists of two sets of values:
- %K - compares the closing price of the period, the value of which is being calculated, to the high-low trading range over a specified number of periods. In other words, it measures the level of the
closing price of the period relative to the high-low range over a given period of time. Assume that the highest price over the specified number of periods equals 110, the lowest one equals 100, and the
closing price of the period being calculated equals 108. The high-low range is 10, which is the denominator in the %K formula. The closing price less the lowest price equals 8, which is the numerator.
8 divided by 10 equals .80 (or 80%). Multiply this number by 100 to find %K.
- %D - is a signal line, which values are calculated by smoothing of %K.
The oscillator is calculated automatically in accordance with certain mathematical formulas (they are provided later in the article). As a result, values of both lines in the range from 0 through 100 are obtained for each period. On a chart, the STOCHASTIC oscillator is drawn in the form of two lines moving up and down parallel to each other within this range (0 - 100). From time to time, they cross over certain fixed levels and each other. The levels serve determining whether an instrument is overbought or oversold. The lines' crisscrossing can be a trading signal (read later in the article).
A Stochastic oscillator is always drawn in an additional area below the market price chart.
On the following picture, you can see an example of the STOCHASTIC oscillator (with all its important level lines) drawn in an additional area below the market price chart.
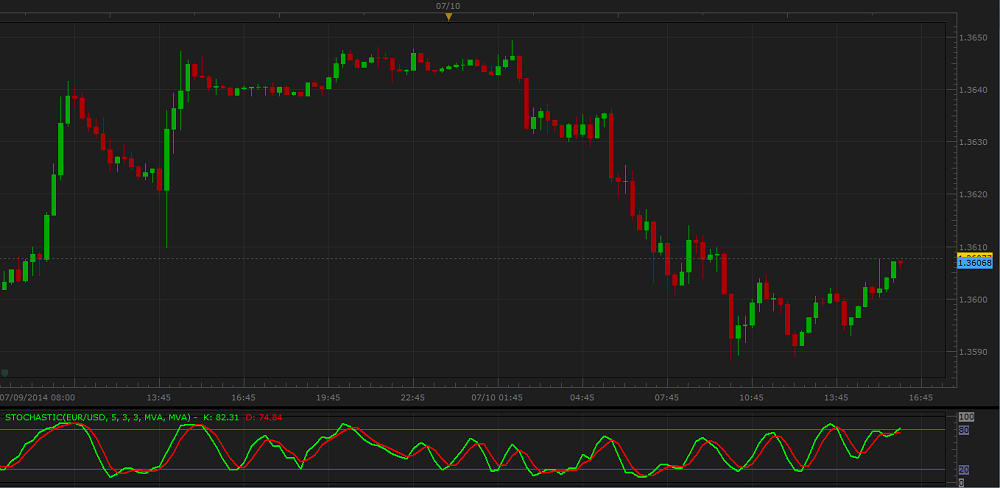
Please remember that the oscillator uses the historical data for its calculation, and all the information it provides belongs to the past. Indicators do not predict the market price future behavior. A trader can only suppose that the past tendencies will continue to develop in the same way for some time in the future and try to use this supposition appropriately.
As a momentum oscillator, STOCHASTIC suits both ranging and trending markets, provided the trend takes on a zigzag format.
In calculation of the signal %D line, the oscillator employs an additional smoothing technique resulting in its noticeable lagging behind the %K line.
The STOCHASTIC oscillator works well in company with a bar chart and other indicators, especially trend-following ones.
To apply a STOCHASTIC oscillator to a chart, a trader needs to follow the procedure common to all Marketscope indicators. For more information, see the Add Indicator article.
During the procedure, a trader can customize the oscillator by specifying its parameters in the Properties dialog box. For more information, see the Change Indicator Properties
article.
The parameters fall into three groups:
- Calculation - the parameters needed to calculate an indicator's prices.
- Style and Appearance - the parameters needed to specify the way an indicator appears on a chart.
- Levels - the parameters needed to specify the values of overbought and oversold level lines.
The STOCHASTIC oscillator has several Calculation parameters:
- Number of periods for %K - the parameter allows to specify the number of periods, over which the %K line is to be calculated. Please note that as the %K line's values are used for
calculation of the %D line's ones, the parameter's modification affects the shape of the %D line as well. The possible values are from 2 through 1,000. The default value is 5. The
smaller the number is, the more sensitive the oscillator becomes. Its %K and %D lines produce more choppy waves and cross the Overbought and Oversold level lines more often
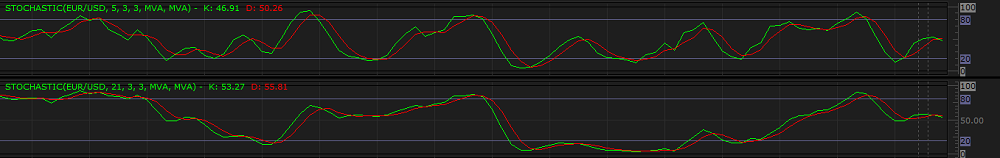
resulting in more frequent trading signals. The greater the number is, the less sensitive the oscillator becomes. Its %K and %D lines are smoother and cross the Overbought and Oversold level lines less often producing fewer trading signals. Traders choose the Number of periods for %K parameter's value in accordance with their need of the level of sensitivity of the oscillator. The recommended and most commonly used values are in the range from 5 through 10 when the oscillator is used together with some other indicators or 14 and 21 when it is used alone.
On the following picture, you can see examples of STOCHASTIC oscillators with different Number of periods for %K parameter's values (5 and 21).
- %D slowing periods - the parameter allows to specify the number of periods of the smoothing technique (in Marketscope, it can be either MVA or EMA) used in calculation of the %K
and %D lines. The possible values are from 2 through 1,000. The default value is 3. The smaller the number is, the more sensitive the oscillator becomes. Its %K and %D lines
react to the changes of the market price momentum faster, produce more choppy waves, and cross the Overbought and Oversold level lines more often resulting in more frequent trading signals.
The greater the number is, the less sensitive the oscillator becomes. Its %K and %D lines react to the changes of the market price momentum slower, produce smoother waves, and cross the
Overbought and Oversold level lines less often resulting in fewer trading signals. Traders choose the %D slowing periods parameter's value in accordance with their need of the level of
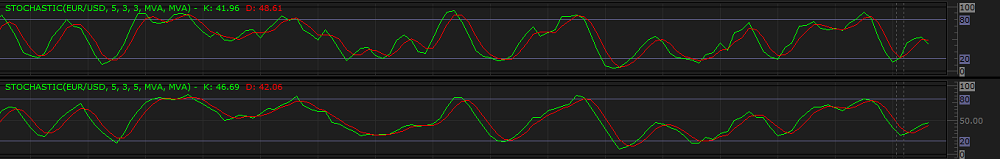
sensitivity of the oscillator. The recommended and most commonly used value is 3 when the oscillator is used together with some other indicators or 5 when it is used alone.
On the following picture, you can see examples of the STOCHASTIC oscillators with different %D slowing periods parameter's values (3 and 5).
- Number of periods for %D - the parameter allows to specify the number of periods, over which the smoothing technique of the %D line is to be calculated (in Marketscope, it can be
either MVA or EMA) when applied to the %K line's values. Please note that the parameter does not affect the %K line and its shape remains intact when the %D periods' parameter changes.
It smooths the %D line causing its lagging behind the %K line. The possible values are from 2 through 1,000. The default value is 3. The smaller the number is, the more sensitive the
oscillator's %D line becomes. It produces more choppy waves, stays closer to the %K line, and crosses the Overbought and Oversold level lines more often resulting in more
frequent trading signals. The greater the number is, the less sensitive the oscillator's %D line becomes. It is smoother, stays more away from the %K line, and crosses the Overbought and
Oversold level lines less often resulting in fewer trading signals. Traders choose the Number of periods for %D parameter's value in accordance with their need of the level of sensitivity of the
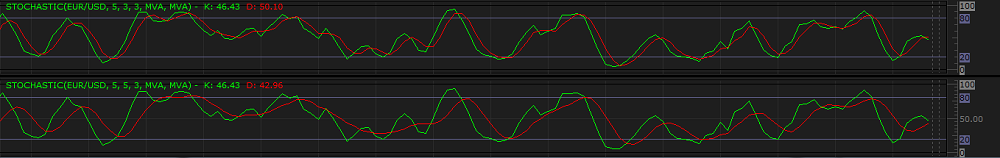
oscillator's %D line. The recommended and most commonly used value is 3 when the oscillator is used together with other indicators and 5 when it is used alone.
On the following picture, you can see examples of the STOCHASTIC oscillators with different Number of periods for %D parameter's values (3 and 5).
- Smoothing type for %K - the parameter allows to specify the smoothing technique to be used in calculation of the %K line. The available values are MVA, EMA, and
Fast Smoothed. For more information, read the MVA (Simple Moving Average) and EMA (Exponential Moving Average) articles and see calculation formulas later in this article. The
default value is MVA.
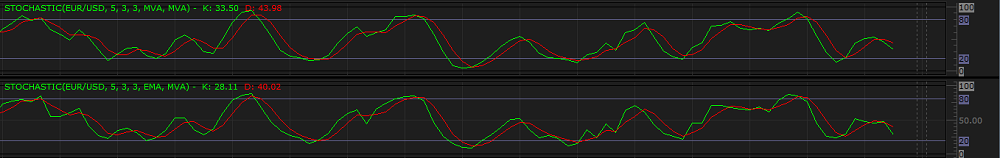
On the following picture, you can see examples of the STOCHASTIC oscillators with different Smoothing type for %K parameter's values (MVA and EMA). With the EMA smoothing technique, the %K line has a smaller lagging than that of the one with the MVA smoothing technique.
- Smoothing type for %D - the parameter allows to specify the smoothing technique to be used in calculation of the %D line. The available values are MVA and EMA. For more information, read the MVA (Simple Moving Average) and EMA (Exponential Moving Average) articles. The default value is MVA.
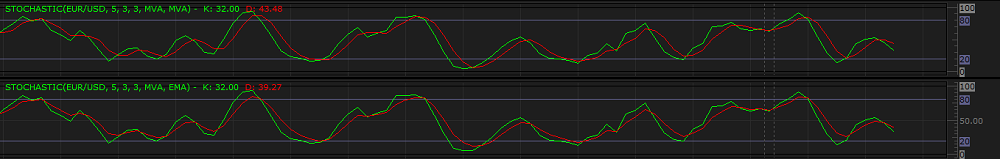
On the following picture, you can see examples of the STOCHASTIC oscillators with different Smoothing type for %D parameter's values (MVA and EMA). With the EMA smoothing technique, the %D line has a smaller lagging than that of the one with the MVA smoothing technique.
The parameters are available on the Parameters tab of the STOCHASTIC Properties dialog box under the Calculation heading.
The STOCHASTIC oscillator has several Levels' parameters:
- Overbought level - the parameter allows to specify the threshold, at which an instrument can be considered to be overbought. The possible values are from 0 through 100. The default value is 80.
Traders choose the parameter's values in accordance with their need of the level of the threshold. The recommended and most commonly used value is the default one - 80.
- Oversold level - the parameter allows to specify the threshold, at which an instrument can be considered to be oversold. The possible values are from 0 through 100. The default value is 20. Traders choose the parameter's values in accordance with their need of the level of the threshold. The recommended and most commonly used value is the default one - 20.
- Line levels width - the parameter allows to specify the widths of the Overbought and Oversold level lines, and it works as the Lines width parameter listed under the Style
heading on the Parameters tab of the Properties dialog box. For more information, read the Change Indicator Properties article.
- Line levels style - the parameter allows to specify the styles of the Overbought and Oversold level lines, and it works as the Lines style parameter listed under the Style
heading on the Parameters tab of the Properties dialog box. For more information, read the Change Indicator Properties article.
- Line levels color - the parameter allows to specify the colors of the Overbought and Oversold level lines, and it works as the Lines color parameter listed under the Style
heading on the Parameters tab of the Properties dialog box. For more information, read the Change Indicator Properties article.
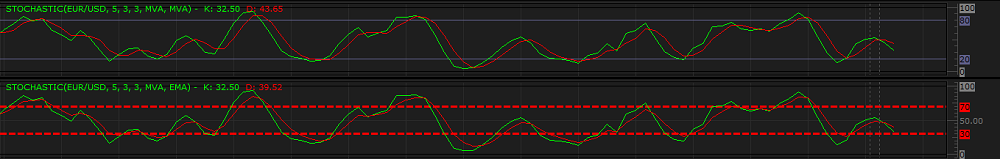
On the following picture, you can see how oscillators of different Levels' parameters (with level lines of different Overbought level and Oversold level values, widths, styles, and colors) look like on a chart.
The parameters are available on the Parameters tab of the STOCHASTIC Properties dialog box under the Levels heading.
When a STOCHASTIC oscillator is drawn on a chart, a trader can analyze its information and try to interpret it correctly. STOCHASTIC produces several trading signals:
- Divergences and Set-ups
According to George C. Lane, the first, and most important, signal that STOCHASTIC produces is a divergence. Under this term, he understood the movement of the market prices and oscillator in the opposite directions (divergence itself) and towards each other (generally called convergence). It is a very strong signal of a possible trend reversal. Apart from divergence, George C. Lane employed the term set-up that he identified as an inverse form of divergence. In other words, if a divergence uses High prices of a period, a set-up of a similar direction uses Low ones. Divergences and set-ups are further subdivided into the following four types:
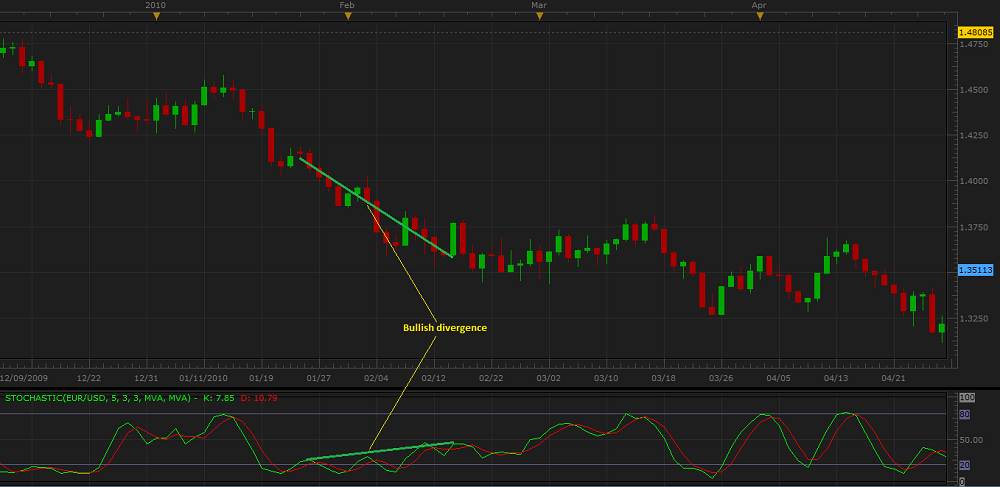
- Bullish divergence occurs when an instrument's Low prices move down, but the STOCHASTIC oscillator moves flat or up. This shows less downside momentum that can be treated as a warning of a bullish reversal and the need to consider closing of Sell positions and opening of Buy ones.
On the following picture, you can see an example of a bullish divergence.
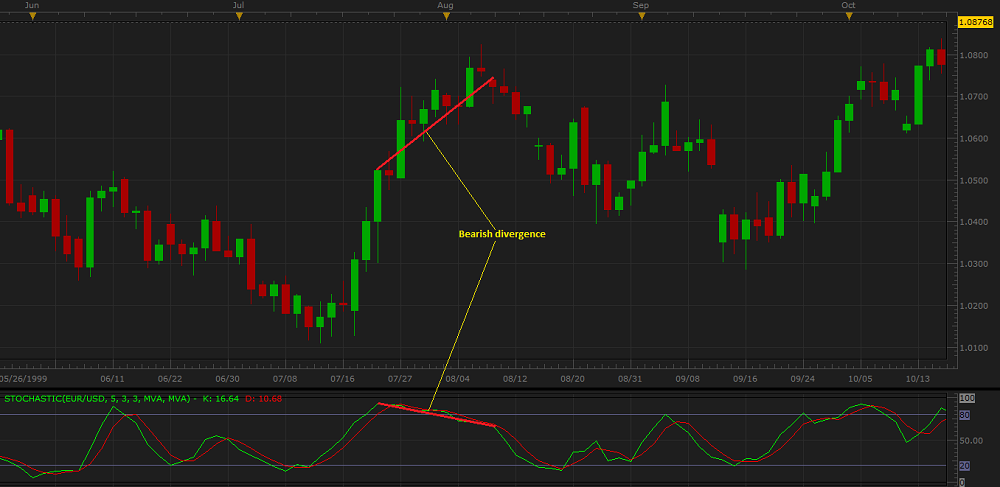
- Bearish divergence occurs when an instrument's High prices move up, but the STOCHASTIC oscillator moves flat or down. This shows less upside momentum that can be treated as a warning of a bearish reversal and the need to consider closing of Buy positions and opening of Sell ones.
On the following picture, you can see an example of a bearish divergence.
Once a divergence takes hold, a trader should look for a confirmation of an actual reversal. A bullish divergence can be confirmed by a resistance break on the price chart or a STOCHASTIC oscillator's breaking above the mark of 50, which is the centerline on a STOCHASTIC chart. A bearish divergence can be confirmed by a support break on the price chart or a STOCHASTIC oscillator's breaking below the mark of 50 on its way down.
Please note that divergences are often misleading in a strong price trend: a bullish (or bearish) divergence can occur in a strong downtrend (or uptrend) and yet the strong downtrend (or uptrend) continues.
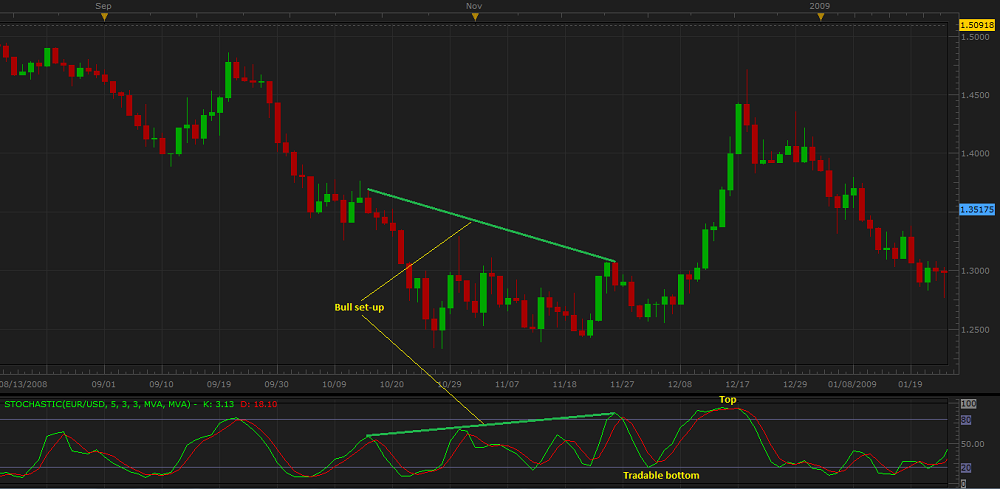
- Bull set-up, as it has been said earlier, is basically the inverse of a bullish divergence: when an instrument's High prices move down, the STOCHASTIC oscillator moves flat or up. This shows strengthening upside momentum. The next decline is then expected to result in a tradable bottom and the need to consider closing of Sell positions and opening of Buy ones.
On the following picture you can see an example of a bull set-up resulting in a tradable bottom at the next decline followed by a bullish uptrend.
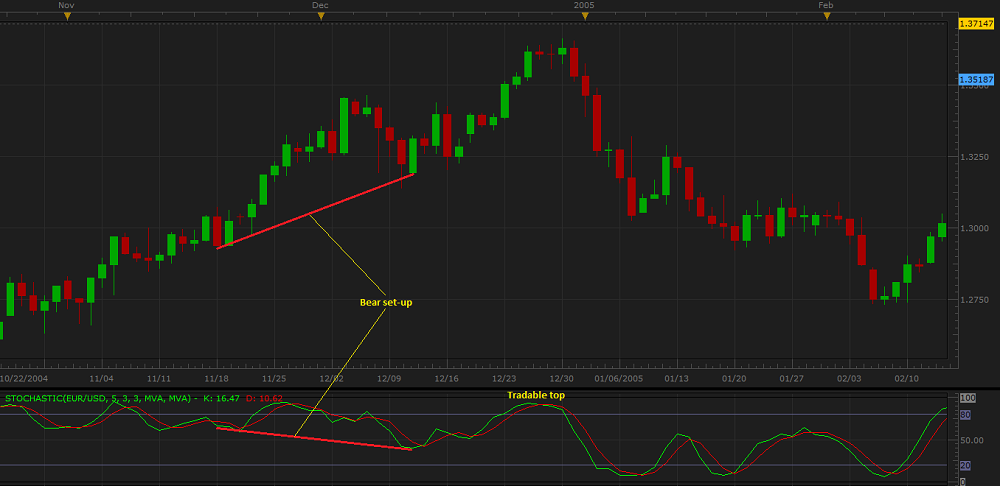
- Bear set-up, as it has been said earlier, is basically the inverse of a bearish divergence: when an instrument's Low prices move up, the STOCHASTIC oscillator moves flat or down. This shows increasing downside momentum. The next advance is expected to result in a tradable top and the need to consider closing of Buy positions and opening of Sell ones.
On the following picture you can see an example of a bear set-up resulting in a tradable top at the next climb up followed by a bearish downtrend.
Note also that George C. Lane warned traders that a set-up was not a signal as it is. It only foreshadows a tradable situation in the near future and requires additional confirmations before making a trading decisions.
- Overbought and Oversold Levels
Because the STOCHASTIC oscillator is range bound, it is also useful for identifying whether an instrument is overbought or oversold. An instrument is overbought when STOCHASTIC reaches or exceeds the Overbought level. It is oversold when the oscillator's lines on the way down reach the Oversold level or drop below it. The scenarios produce the following trading signals:
- The STOCHASTIC oscillator's lines rising above the Overbought level can be a warning of a possible trend reversal downwards and the need to consider closing of Buy positions and opening of Sell ones.
- The STOCHASTIC oscillator's lines dropping below the Oversold level can be a warning of a possible trend reversal upwards and the need to consider closing of Sell positions and opening of Buy ones.
On the following picture, you can see examples of the Overbought and Oversold signals.

Note: An instrument can stay overbought or oversold for a long period of time. Therefore, if STOCHASTIC crosses the Overbought or Oversold level, do not undertake immediate actions until the oscillator's lines cross the level in the opposite direction.
- Line crossing
The oscillator's lines move up and down occasionally crossing each other. The trading signals are:
- Crossing of the %D line by the %K line from above foreshadows a possible trend reversal downwards and the need to consider closing of Buy positions and opening of Sell ones.
- Crossing of the %D line by the %K line from below foreshadows a possible trend reversal upwards and the need to consider closing of Sell positions and opening of Buy ones.
On the following picture, you can see examples of the line crossing signals:

The STOCHASTIC oscillator's values are calculated automatically using the following formulas:
Smoothing type for %K is MVA or EMA
%Ki = K-period MA of 100 x (Closei - LowestN) / (HighestN - LowestN)
where:
%Ki - is the oscillator's %K line value of the period being calculated.
K-period - is the number of periods (specified by the Number of periods for %K parameter), over which MA is calculated.
MA - is the MVA or EMA indicator (specified by the Smoothing type for %K parameter).
N - is the number of periods, over which the %K line value is calculated (specified by the %D slowing periods parameter).
Closei - is the closing price value of the period being calculated.
LowestN - is the lowest value of the N-period time frame.
HighestN - is the highest value of the N-period time frame.
Smoothing type for %K is Fast Smoothed
%Ki = 100 x Sum of (Closei - LowestN) / Sum of (HighestN - LowestN)
where:
Sum of (Closei - LowestN = (Closei - Lowesti) + (Closei-1 - Lowesti-1) + ... + (Closei-N+1 - Lowesti-N+1)
Sum of (HighestN - LowestN) = (Highesti - Lowesti) + (Highesti-1 - Lowesti-1) + ... + (Highesti-N+1 - Lowesti-N+1)
where:
%Ki - is the oscillator's %K line value of the period being calculated.
N - is the number of periods, over which the %K line value is calculated (specified by the %D slowing periods parameter).
Closei - is the closing price value of the period being calculated.
LowestN - is the lowest value of the N-period time frame.
HighestN - is the highest value of the N-period time frame.
%Di = D-period MA of %Ki
where:
%Di - is the oscillator's signal %D line value of the period being calculated.
D-period - is the number of periods (specified by the Number of periods for %D parameter), over which MA is calculated.
MA - is the MVA or EMA indicator (specified by the Smoothing type for %D parameter).
%Ki - is the oscillator's %K line value of the period being calculated.
back