WMA (Wilder's Moving Average)
WMA (Wilder's Moving Average) is a weighted moving average indicator. It was developed by Welles Wilder and presented for the first time in his book New Concepts in Technical Trading in 1978.
As all the other moving average indicators, the WMA indicator smooths the market noises and shows the market trends more clearly. To achieve the goal, the indicator filters out the market fluctuations (noises)
by averaging the price values of the periods, over which it is calculated. In the process, some extra value (weight) is added to the average prices, as it is done during calculations of all weighted indicators,
such as EMA, LWMA, and SMMA. Of all weighted indicators, EMA is the closest one to WMA in the way they are calculated. But the WMA indicator's
calculation produces values approximately two times smaller than those of the EMA indicator's calculation. Thus, the WMA indicator of N number of periods is almost identical to the EMA indicator of twice
greater number of periods.
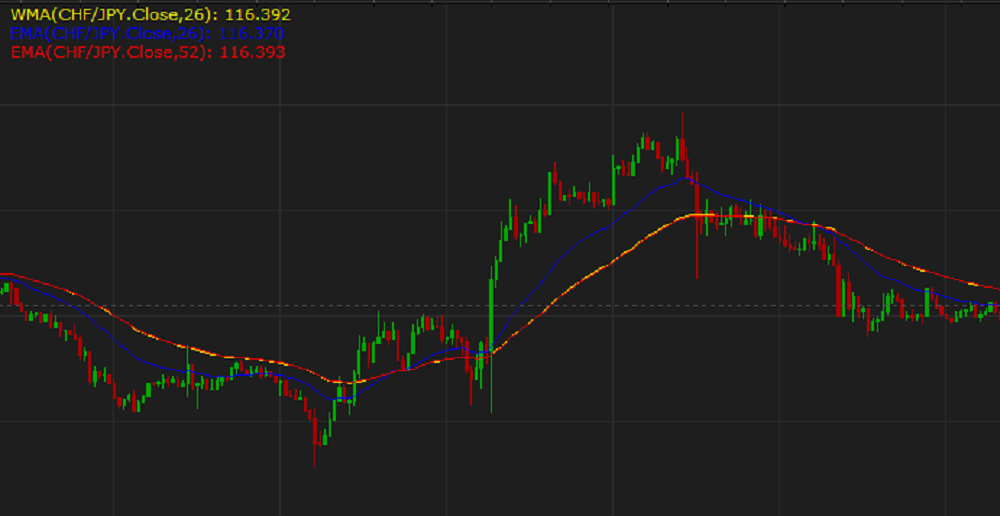
On the following picture, the yellow line of the WMA indicator of 26 periods almost completely coincides with the red line of the EMA indicator of 52 periods, whereas it is noticeably slower than
the blue line of the EMA indicator of the same number of 26 periods.
By employing the WMA indicator, a trader gets a crisp picture of the market behavior and can make informed trading decisions. It is good to use a WMA indicator in combination with another WMA indicator of a
different period length or other than WMA indicators.
Because the WMA indicator uses the historical data for its calculation, it reveals the market trend that has already developed and does not show the future trend. A trader can only suppose that the past trend
will continue to develop in the same direction for some time in the future and make appropriate trading decisions.
To apply a WMA indicator to a chart, a trader needs to follow the procedure common to all Marketscope indicators. For more information, see the Add Indicator article.
During the procedure, a trader can customize an indicator by specifying its parameters in the Properties dialog box. For more information,see the Change Indicator Properties article.
The parameters fall into two groups:
- Calculation - the parameters needed to calculate an indicator's prices.
- Style and Appearance - the parameters needed to specify the way an indicator appears on a chart.
The WMA indicator has only one Calculation parameter - Number of periods. The parameter allows to specify the number of periods, over which the indicator is to be calculated. The possible values
are from 2 through 10,000. The default value is 14. The smaller the number is, the less market noises the indicator filters, and the faster it reacts to the market price changes. Its line stays closer to
the price bars, thus, following the shorter-term market trends and producing less lagging. The greater the number is, the more market noises the indicator filters, and the slower it reacts to the price changes.
Its line stays more away from the market price bars, thus, following the longer-term market trends and producing greater lagging behind the market prices. Trader choose the Number of periods' parameter
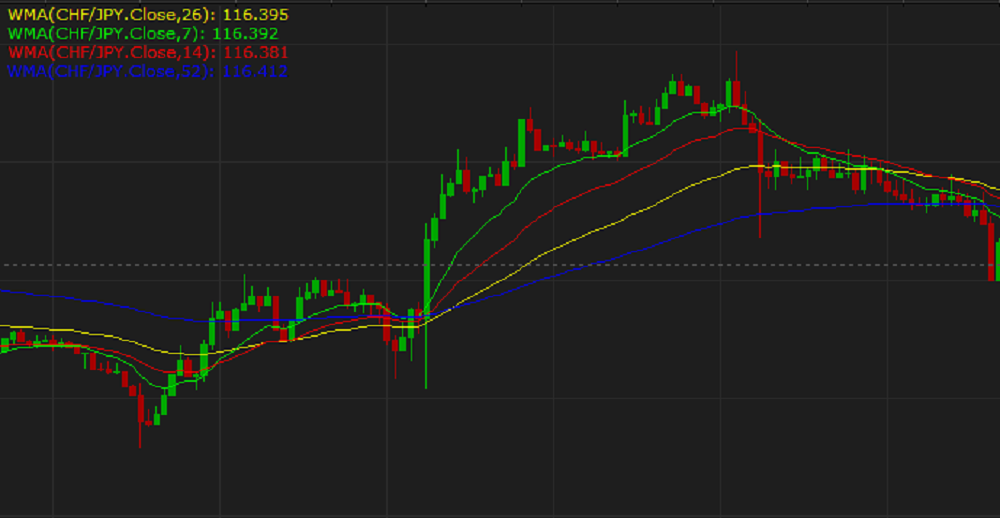
value in accordance with their trading tasks, strategies, and techniques. The commonly used values are 7, 14, 26, and 52.
On the following picture, you can see how indicators with different Number of periods' parameter values look like on a chart.
The parameter is available on the Parameters tab of the WMA Properties dialog box under the Calculation heading.
When a WMA indicator is drawn on a chart, a trader can analyze its behavior and try to predict the beginning of a new market trend or ending of an old one, in other words, determine trend reversal points that
can serve as signals for the actions that are similar to those of the MVA indicator.
The WMA indicator's values are calculated automatically using the following formula:
WMAi = WMAi-1 + (Pricei - WMAi-1) / N
where:
WMAi - is the WMA value of the current period.
WMAi-1 - is the value of the period immediately preceding the period being calculated,
Pricei - is the source (Close or other) price of the current period.
N - is the number of periods, over which the indicator is calculated.
back