AC (Acceleration/Deceleration)
AC (Acceleration/Deceleration) is one of five Bill Williams' indicators included in the list of standard indicators of Marketscope (the other four are ALLIGATOR (Alligator),
GATOR (Gator), AO (Awesome Oscillator), and FRACTAL (Fractal)). It was developed in 1995 and presented in Bill Williams' book New Trading
Dimensions.
AC is intended to provide information about acceleration and deceleration of the current market momentum. In very general words, momentum can be explained as the quantity of motion of a moving body.
Bill Williams believes that the market prices follow the market momentum changes, and before the momentum changes its direction, deceleration to a complete zero followed by acceleration must take place.
Therefore, the monitoring of the market momentum acceleration and deceleration helps to foresee the market price changes.
For monitoring the momentum acceleration and deceleration, AC calculates the immediate momentum of the current period, smooths it by applying the MVA indicator technique, and compares the
two values to see whether the momentum accelerates or decelerates. The AC values are calculated automatically as the difference between the period's AO (Awesome Oscillator) value and its
smoothed version. (The mathematical formula is provided later in the article).
On a chart, the values are presented as a histogram. The bars oscillate around the zero line, but, unlike the AO histogram, crossing the zero line on the AC histogram does not produce any trading signals. It
is the color of the bars that indicates that the market momentum is accelerating or decelerating. By default, a bar is green if its value is greater than the value of the immediately preceding
one (acceleration) and red if its value is smaller than the one of the immediately preceding bar (deceleration). The longer the bars are, the greater the market momentum's acceleration/deceleration is and
vice versa. Steady growth of the bars in one direction signals that the market momentum is changing (acceleration/deceleration), thus, influencing the market price changes (uptrend/downtrend). Note that AC is
always drawn in an additional area below the market price chart.
On the following picture you can see an example of the AC oscillator.
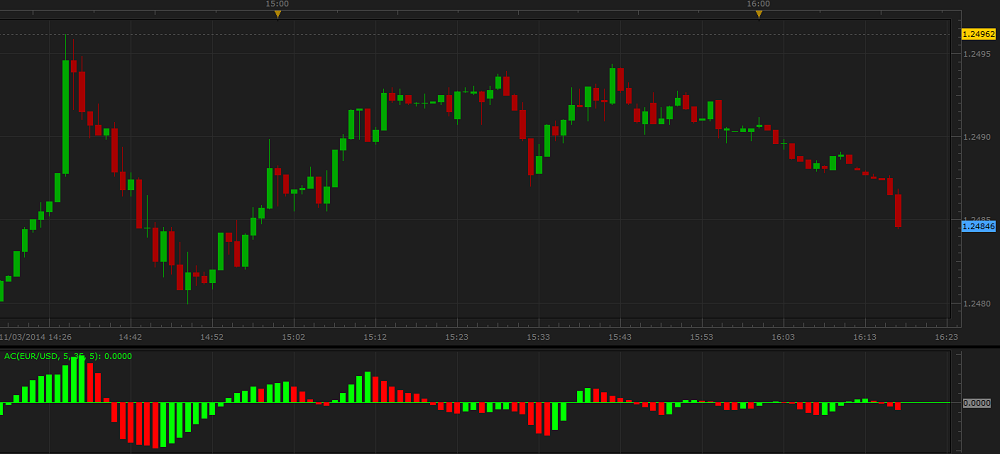
According to Bill Williams, the AC, ALLIGATOR, AO, and FRACTAL indicators form a complex trading system and work best when they are used in conjunction with each other.
Please remember that as its Data Source the indicator uses the historical data and provides the information that belongs to the past. A trader can only suppose that the market situation will continue
to develop in the same way for some time in the future and try to use the supposition appropriately.
To apply an AC oscillator to a chart, a trader needs to follow the procedure common to all Marketscope indicators. For more information, see the Add Indicator article.
During the procedure, a trader can customize an oscillator by specifying its parameters in the Properties dialog box. For more information, see the Change Indicator Properties
article.
The parameters fall into two groups:
- Calculation - the parameters needed to calculate an oscillator's prices.
- Style and Appearance - the parameters needed to specify the way an oscillator appears on a chart.
AC has the following Calculation parameters:
- Fast MA periods - the parameter allows specifying the number of periods, over which the shorter-period moving average of the AO indicator's value used in the AC calculation formula (see the
mathematical formula later in the article) is to be calculated. The possible parameter's values are from 2 through 10,000. The default value is5. The smaller the number is, the more sensitive
the AC oscillator is and vice versa. The most popular is the default value -5.
- Slow MA periods - the parameter allows specifying the number of periods, over which the longer-period moving average of the AO indicator's value used in the AC calculation formula (see the
mathematical formula later in the article) is to be calculated. The possible parameter's values are from 2 through 10,000. The default value is 35. The smaller the number is, the more sensitive
the AC oscillator is and vice versa. The most popular is the default value - 35.
- MA periods for Acceleration/Deceleration - the parameter allows specifying the number of periods, over which the MVA smoothening technique of the AO value is to be calculated (see the
mathematical formula later in the article). The possible parameter's values are from 2 through 10,000. The default value is 5. The smaller the number is, the more sensitive the AC oscillator is
and vice versa. The most popular is the default value - 5.
The parameters are available on the Parameters tab of the AC Properties dialog box under the Calculation heading.
AC has two Style parameters:
- Higher Bars color - the parameter allows specifying the color of the histogram's bar, the value of which is greater than the value of the immediately preceding one. The default value is
green.
- Lower Bars color - the parameter allows specifying the color of the histogram's bar, the value of which is smaller than the value of the immediately preceding one. The default value is red.
The parameters are available on the Parameters tab of the AC Properties dialog box under the Style heading.
When an AC oscillator is drawn on a chart, a trader can analyze its information and try to interpret it correctly.
AC produces the following trading signals:
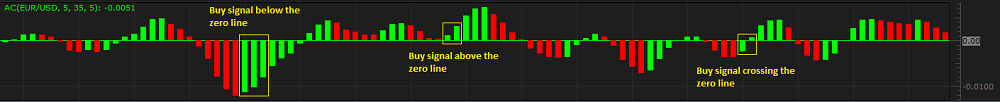
- Buy signals above the zero line - the signals are generated when at least two consecutive green bars following a red bar occur above the histogram's zero line. The signal should be confirmed by
a FRACTAL oscillator's buy sign outside the ALLIGATOR mouth (above the red Jaw line). Only the latest signal (at least two green bars that are the last bars of the histogram) should be used for taking
trading decisions. Consider opening of Buy positions and closing of opened Sell ones.
- Buy signals below the zero line - the signals are generated when at least three consecutive green bars following a red bar occur below the histogram's zero line. The signal should be confirmed
by a FRACTAL oscillator's buy sign outside the ALLIGATOR mouth (above the red Jaw line). Only the latest signal (at least three green bars that are the last bars of the histogram) should be used for
taking trading decisions. Consider opening of Buy positions and closing of opened Sell ones.
Note that Bill Williams believes that when the histogram bars cross the zero line from below to above, only two green bars are enough for a Buy signals below the zero line signal to occur.
On the following picture you can see all AC Buy signals.
- Sell signals below the zero line - the signals are generated when at least two consecutive red bars following a green bar occur below the histogram's zero line. The signal should be confirmed by
a FRACTAL oscillator's sell sign outside the ALLIGATOR mouth (below the red Jaw line). Only the latest signal (at least two red bars that are the last bars of the histogram) should be used for taking
trading decisions. Consider opening of Sell positions and closing of opened Buy ones.
- Sell signal above the zero line - the signals are generated when at least three consecutive red bars following a green bar occur above the histogram's zero line. The signal should be confirmed by
a FRACTAL oscillator's sell sign outside the ALLIGATOR mouth (below the red Jaw line). Only the latest signal (at least three red bars that are the last bars of the histogram) should be used for taking
trading decisions. Consider opening of Sell positions and closing of opened Buy ones.
Note that Bill Williams believes that when the histogram bars cross the zero line from above to below, only two red bars are enough for a Sell signals above the zero line signal to occur.
On the following picture you can see all AC Sell signals.

The AC oscillator's values are calculated automatically using the following formula:
AC = AO - MVA(AO)
where:
AC - is the AC value of the period being calculated.
AO - is the AO (Awesome Oscillator) value of the period being calculated (the number of periods is specified by the Fast MA periods and Slow MA periods parameters).
MVA(AO) - is the AO value of the period being calculated (the number of periods is specified by the Fast MA periods and Slow MA periods parameters) that is smoothed by the MVA
indicator smoothening technique (the number of periods is specified by the MA periods for Acceleration/Deceleration parameter).
back