ALLIGATOR (Alligator)
ALLIGATOR (Alligator) is one of five Bill Williams' indicators included in the list of standard indicators of Marketscope (the other four are AO (Awesome Oscillator),
GATOR (Gator), AC (Acceleration/Deceleration), and FRACTAL (Fractal)). It was developed in 1995 and presented in Bill Williams' book New
Trading Dimensions.
Alligator is a metaphor used by the author because he saw a lot of similarity in the behavior of the indicator on the chart and an alligator in the wilds. To Bill Williams, the shapes formed by the
indicator's lines resemble the creature's big mouth with jaws, teeth, and lips, as well as how it sleeps, wakes up, eats, and falls asleep again. In this article, we will keep the author's metaphoric
terminology.
In his book, Bill Williams states: "Most of the time, the market goes nowhere. Only 15 to 30 percent of the time does the market trend, and traders who are not on the floor make nearly all of their profits
in a trending market."
ALLIGATOR is intended to help detecting the market price trend's presence or absence, and, if the trend is present, its beginning and ending.
For this purpose, ALLIGATOR employs a moving average indicator with three different sets of calculation parameters (read later in the article). The indicator values are calculated automatically and form
three lines on the price chart:
- Alligator Jaw Line (blue by default) - is the line of a longer-period moving average indicator (by default, a 13-period SMMA shifted into the future by eight periods).
- Alligator Teeth Line (red by default) - is the line of a medium-period moving average indicator (by default, an eight-period SMMA shifted into the future by five periods).
- Alligator Lips Line (green by default) - is the line of a shorter-period moving average indicator (by default, a five-period SMMA shifted into the future by three periods).
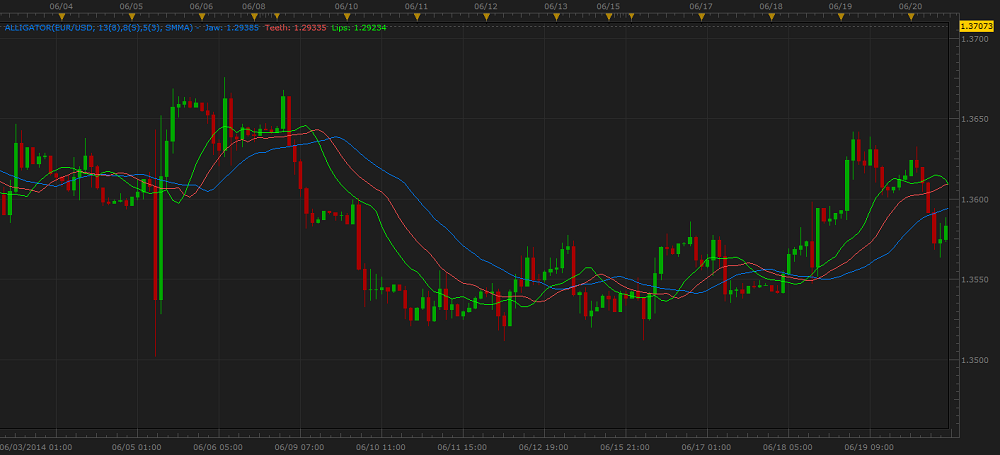
On the price chart, the lines can stay together intertwining (ranging market), or they can diverge from each other (beginning of a trend), and stay more or less parallel to each other for some time
(trending market), and then converge again (ending of a trend). The direction of the lines moving up or down on the chart indicates the trend's direction (uptrend or downtrend).
On the following picture you can see an example of the ALLIGATOR indicator drawn on the market price chart.
According to Bill Williams, the ALLIGATOR, AC, AO, and FRACTAL indicators form a complex trading system and work best when they are used in conjunction with each other.
Please remember that as its Data Source the indicator uses the historical data and provides the information that belongs to the past. A trader can only suppose that the market situation will continue
to develop in the same way for some time in the future and try to use the supposition appropriately.
To apply an ALLIGATOR indicator to a chart, a trader needs to follow the procedure common to all Marketscope indicators. For more information, see the Add Indicator
article.
During the procedure, a trader can customize the indicator by specifying its parameters in the Properties dialog box. For more information, see the Change Indicator Properties
article.
The parameters fall into two groups:
- Calculation - the parameters needed to calculate an indicator's prices.
- Style and Appearance - the parameters needed to specify the way an indicator appears on a chart.
ALLIGATOR has the following Calculation parameters:
- Alligator Jaw smoothing periods - the parameter allows specifying the number of periods, over which the longer-period moving average indicator is to be calculated. The possible parameter's values are
from 1 through 300. The default value is 13. The smaller the number is, the more sensitive to the market changes the ALLIGATOR indicator is, and vice versa. The most popular is the default
value - 13.
- Alligator Jaw shifting periods - the parameter allows specifying the number of periods, over which the longer-period moving average indicator is to be shifted into the future. The possible parameter's
values are from 0 through 300. The default value is 8. The smaller the number is, the more sensitive to the market changes the ALLIGATOR indicator is and vice versa. The most popular is the default
value - 8.
- Alligator Teeth smoothing periods - the parameter allows specifying the number of periods, over which the medium-period moving average indicator is to be calculated. The possible parameter's values
are from 1 through 300. The default value is 8. The smaller the number is,
the more sensitive to the market changes the ALLIGATOR indicator is and vice versa. The most popular is the default value - 8.
- Alligator Teeth shifting periods - the parameter allows specifying the number of periods, over which the medium-period moving average indicator is to be shifted into the future. The possible
parameter's values are from 0 through 300. The default value is 5. The smaller the number is, the more sensitive to the market changes the ALLIGATOR indicator is and vice versa. The most
popular is the default value - 5.
- Alligator Lips smoothing periods - the parameter allows specifying the number of periods, over which the shorter-period moving average indicator is to be calculated. The possible parameter's values
are from 1 through 300. The default value is 5. The smaller the number is, the more sensitive to the market changes the ALLIGATOR indicator is and vice versa. The most popular is the default
value - 5.
- Alligator Lips shifting periods - the parameter allows specifying the number of periods, over which the shorter-period moving average indicator is to be shifted into the future. The possible parameter's
values are from 0 through 300. The default value is 3. The smaller the number is, the more sensitive to the market changes the ALLIGATOR indicator is and vice versa. The most popular is the
default value - 3.
- Smoothing method - the parameter allows specifying the smoothing technique to be applied during the calculation of the ALLIGATOR values. The possible parameter's values are MVA,
EMA, LWMA, SMMA, Vidya (1995), Vidya (1992), and WMA.
The default value is SMMA. Traders choose the smoothing technique in accordance with their needs and preferences. The most popular is the default value - SMMA.
The parameters are available on the Parameters tab of the ALLIGATOR Properties dialog box under the Calculation heading.
Note that the indicator's Style parameters can be specified individually for each line (Jaw, Teeth, and Lips).
When an ALLIGATOR indicator is drawn on a chart, a trader can analyze its information and try to interpret it correctly.
ALLIGATOR produces two major trading signals:
- Ranging Market Confirmation
When the indicator's lines intertwine with each other and move horizontally, the market is ranging and no trend is present. The alligator is sleeping, and its mouth is closed, to put it metaphorically.
It is wise to refrain from trading and wait till a trend begins.
- Trending Market Confirmation
When the indicator's lines diverge from each other and start to move in an upward or downward direction staying more or less parallel to each other, a trend of a respective direction begins and stays on
till the lines start to converge. To put it metaphorically, the alligator wakes up, feels the smell of food and opens the mouth to eat. When it is fed, the alligator closes its mouth and falls asleep.
The beginning of an uptrend (the alligator opens its mouth) is a signal to consider closing of opened Sell positions and opening of Buy ones. Conversely, the beginning of a downtrend is a
signal to consider closing of opened Buy positions and opening of Sell ones.
When an uptrend or downtrend ends (the alligator closes its mouth), close the respective long or short positions to collect profit.
Note: Bill Williams suggests using the first FRACTAL arrow outside the alligator's mouth (above the Teeth (red by default) line for Buy fractals and below it - for
Sell fractals)) to decide on opening or closing of trading positions.
The ALLIGATOR indicator values are calculated automatically using the formulas of the specified moving average indicators. For more information, see the articles about the appropriate indicators.
back