VIDYA (Chande's Variable Index Dynamic Average)
VIDYA (Chande's Variable Index Dynamic Average) is an adaptive weighted moving average indicator. It was developed by Tushar Chande as an attempt to improve the performance of the
EMA (Exponential Weighted Moving Average) indicator. For the first time, Tushar Chande introduced the indicator in the Technical Analysis of Stocks & Commodities magazine in March 1992.
Later the indicator was modified and presented in The New Technical Trader by Tushar Chande and Stanley Kroll, John Wiley and Sons, New York, 1994.
As all the other moving average indicators, VIDIYA smooths the market noises and shows the market trends more clearly.
To achieve the goals, the indicator filters out the market fluctuations (noises) by
averaging the price values of the periods, over which it is calculated. In the process, some extra value (weight) is added to the average prices, as it is done during calculations of all weighted indicators,
such as EMA, LWMA, and SMMA. But during the VIDIYA indicator's calculation, every period's price receives a weight increment adapted to the current
market's volatility. The calculation formulas are provided later in the article.
Note that the value of the smoothing factor (F) is calculated with the help of the period's EMA, and increasing or decreasing of the value is achieved by using CMO Chande Momentum Oscillator
as a measure of the market's volatility. As a result, the indicator slows down and does not react to the market's volatility when it increases and, on the contrary, speeds up when a strong steady trend takes
place.
On the following picture, the yellow line of the VIDYA indicator of 26 periods remains more indifferent to the market volatility and looks smoother compared to the lines of the other moving average
indicators of the same number of periods.
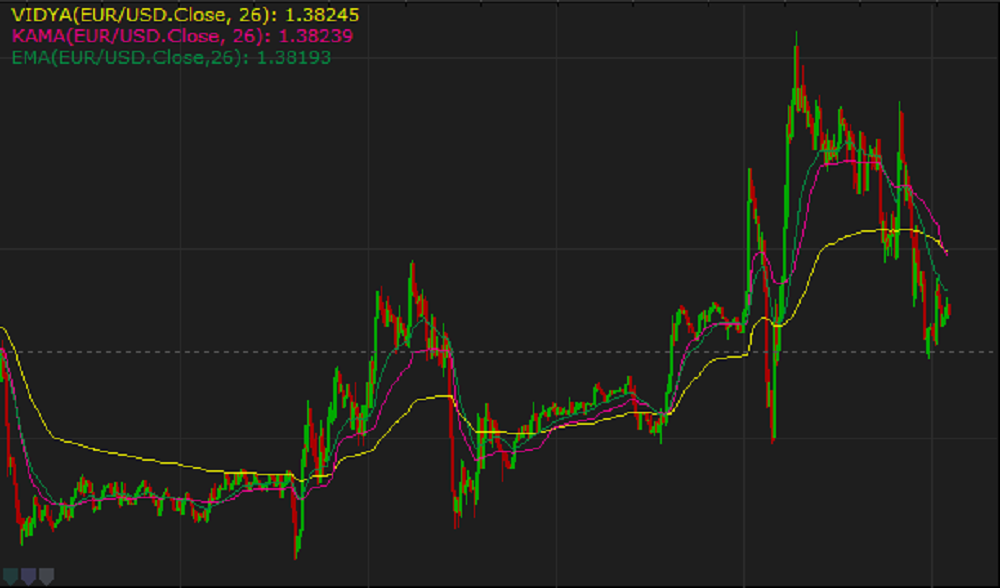
By employing the VIDYA indicator, a trader gets a crisp picture of the market behavior and receives less erroneous signs. This allows making less mistakes in trading decisions.
Because the VIDIYA indicator uses the historical data for its calculation, it reveals the market trend that has already developed and does not show the future trend. A trader can only suppose that the past
trend will continue to develop in the same direction for some time in the future and make appropriate trading decisions.
To apply a VIDIYA indicator to a chart, a trader needs to follow the procedure common to all Marketscope indicators. For more information, see the Add Indicator article.
During the procedure, a trader can customize an indicator by specifying its parameters in the Properties dialog box. For more information,see the Change Indicator Properties article.
The parameters fall into two groups:
- Calculation - the parameters needed to calculate an indicator's prices.
- Style and Appearance - the parameters needed to specify the way an indicator appears on a chart.
The VIDIYA indicator has only one Calculation parameter - Number of periods. The parameter allows to specify the number of periods, over which the indicator is to be calculated. The default value
is 9. The smaller the number is, the less market noises the indicator filters, and the faster it reacts to the market price changes. Its line stays closer to the price bars, thus, following the
shorter-term market trends and producing less lagging. The greater the number is, the more market noises the indicator filters, and the slower it reacts to the price changes. Its line stays more away from the
market price bars, thus, following the longer-term market trends and producing greater lagging behind the market prices. A trader chooses the Number of periods' parameter value in accordance with his or
hers trading tasks, strategies, and techniques. The commonly used values are 7, 14, 26, and 52.
On the following picture, you can see how indicators with different Number of periods' parameters look like on a chart. Note that the lines can be of different style, width, and color.
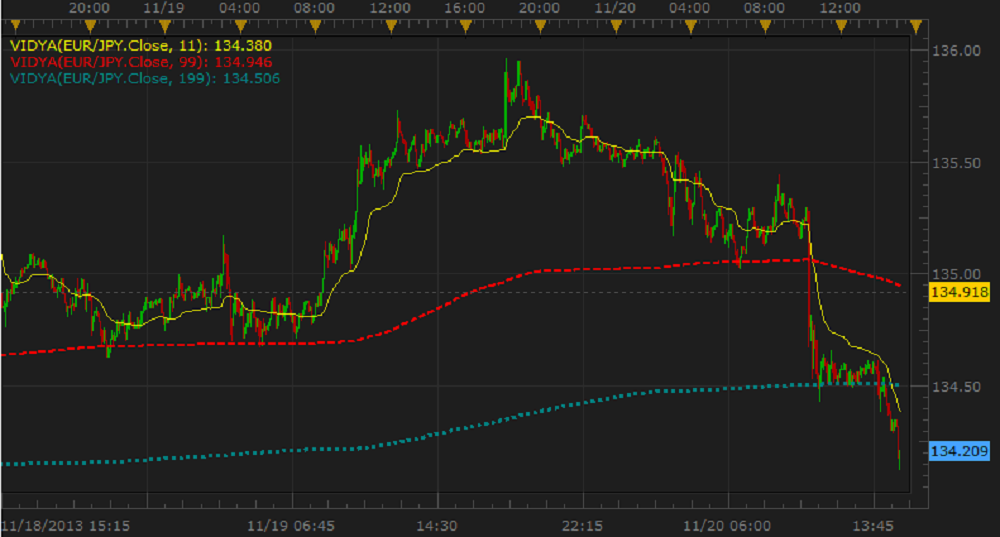
The parameter is available on the Parameters tab of the VIDYA Properties dialog box under the Calculation heading.
When a VIDYA indicator is drawn on a chart, a trader can analyze its behavior and try to predict the beginning of a new market trend or ending of an old one, in other words, determine trend reversal points
that can serve as signals for the actions that are similar to those of the MVA indicator. For more information, see the MVA indicator article.
However, not VIDIYA itself is usually used in trading, but its upper and lower borders (bands), that are by N % above and below the VIDIYA line. To draw the band lines, use the Shift indicator.
On the following picture, the yellow line of the VIDYA indicator of 26 periods is accompanied by the blue lines of its upper and lower bands of the same number of periods.
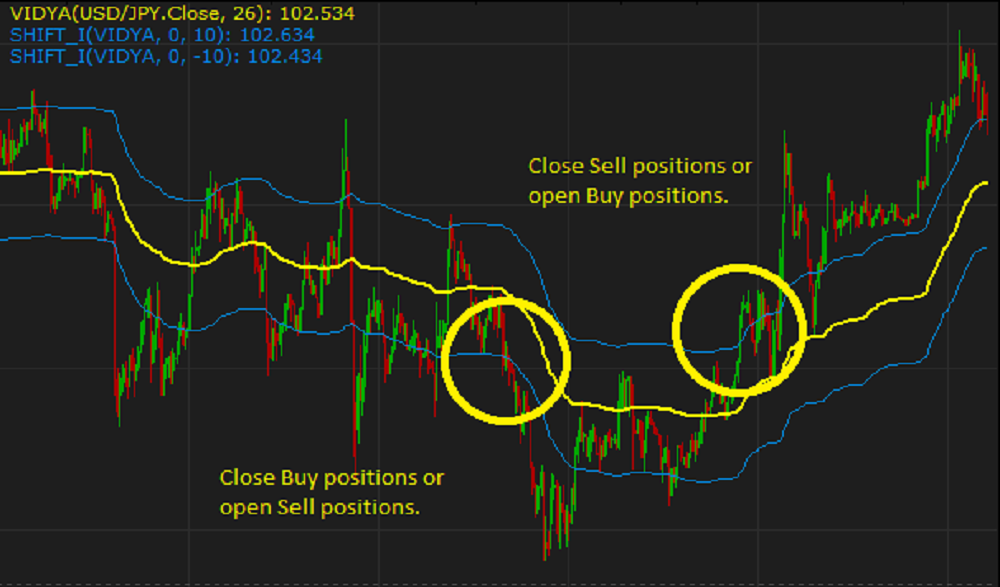
The signals that the bands produce can initiate the following actions:
- Steadily descending band lines are a signal to open Sell positions, and steadily ascending ones are a good signal to open Buy positions.
- If the market price movement is sideways, and the indicator's band lines are more or less horizontal, it is best not to take any actions at all and wait for good signals.
- When the market prices cross over the upper band line from below, it is a signal to close Sell positions or open Buy positions.
- When the market prices cross over the lower band line from above, it is a signal to close Buy positions or open Sell positions.
All the VIDYA values are calculated automatically. First of all, the CMO (Chande Momentum Oscillator) value is calculated using the following formula:
CMOi = (UpSumi - DnSumi) / (UpSumi + DnSumi)
where:
UpSumi - is the sum of positive price increments of the current period.
DnSumi - is the sum of negative price increments of the current period.
This CMO value is then used to calculate the VIDYA indicator:
VIDYAi = Pricei x F x ABS(CMOi) + VIDYAi-1 x (1 - F x ABS(CMOi))
where:
VIDYAi - is the value of the current period.
Pricei - is the source price of the period being calculated.
F = 2/(Period_EMA+1) - is a smoothing factor.
ABS(CMOi) - is the absolute current value of CMO.
VIDYAi-1 - is the value of the period immediately preceding the period being calculated.
The price values of all the periods on the chart are calculated in the same way.
back